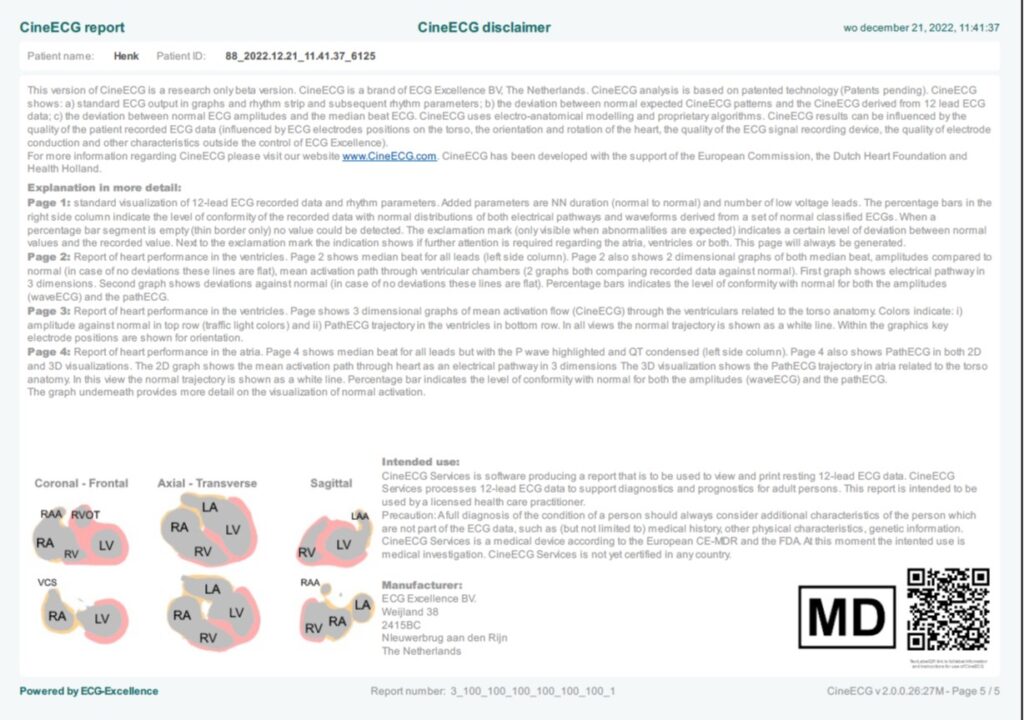
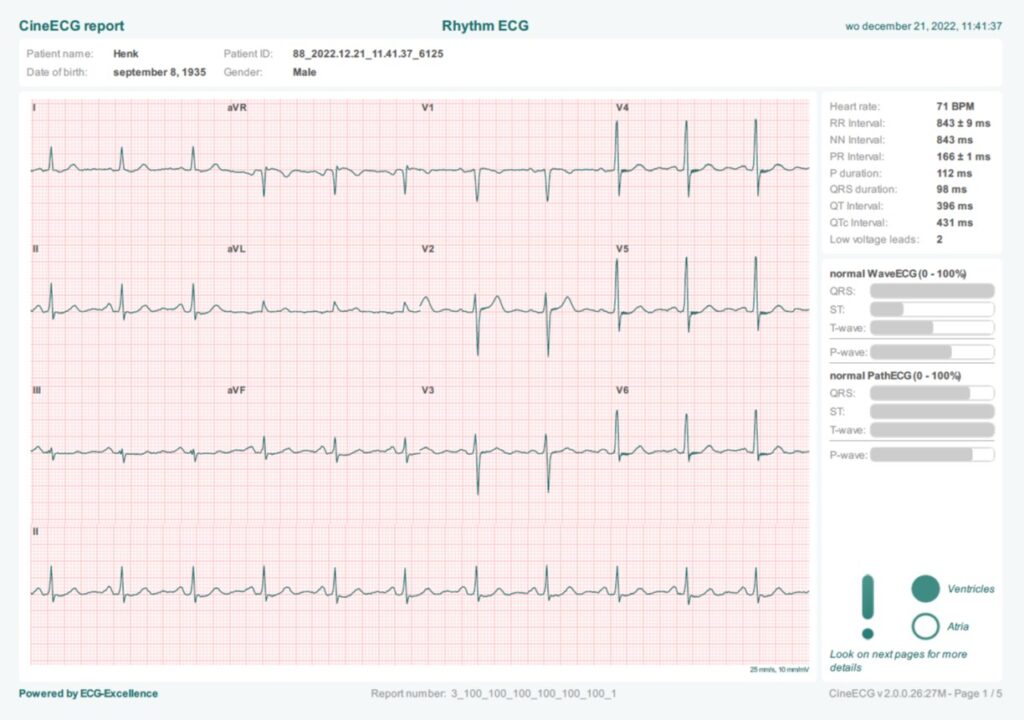
Page 1 shows all the results of the CineECG analyis. Details regarding the results of the ECG waveform comparisons for both the ventricles and atria can be found on pages 2 & 3 for the ventricles and page 4 (atria)
![]()
The report shows the patient information as contained in the received ECG data set.
The gender indication is used to select a normal distribution category which is used in the CineECG analysis process.
Within the selection process three categories are used: Male, Female or Unknown corresponding with the gender indication in the data provided in the ECG data set.

The reports shows the data regarding the recording date/time for the ECG as contained within the received ECG data set.
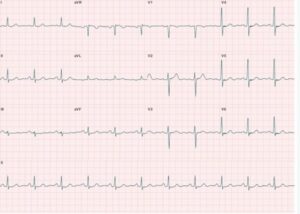 Classic presentation of 4 *3 12 lead ECG data
+ rhythm strip of lead II on bottom row. Standard paper speed on 25 mm/sec is used, and 10 mm / mV.
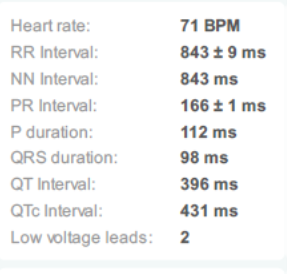
Standard values derived from ECG data by CineECG application.
NN interval is the mean interval between beats with the median morphology, thus excluding eventual PVC or disturbances. The QTc is derived using Bazett’s formula. Low voltage leads gives the number of leads for which the QRS deflection is less than 0.5 mV in the limb and precordial leads. Two or less is a normal number for low voltage leads.
CIneECG does not interpret these parameters. Guidance for ‘normal’ values may be the following table[1]:
[1] Joseph Feher. 5.6 – The Electrocardiogram. Joseph Feher. Quantitative Human Physiology (Second Edition). 2nd. 2012. 537-546.
Joseph Feher. 5.5 – The Cardiac Action Potential. Joseph Feher. Quantitative Human Physiology (Second Edition) An Introduction. 2nd. 2012. 528-536.
Heart Rate (resting ECG): | Max 90 bpm |
RR interval: | Min 670 ms |
NN interval: | Same range as RR interval otherwise expect PVC’s |
PR interval: | Max 120 ms |
QT interval: | Max 450 ms |
QTc interval: | Max 450 ms |
QRS duration: | Max 120 ms |
P-wave duration: | Max 120 ms |
Low voltage leads number | 2 |
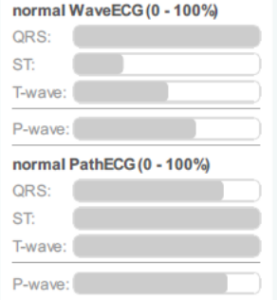 Percentage bars indicate the level of conformity between the recorded ECG data and the bandwidth of ‘normal’ classified ECG’s which have been converted to both PathECG and WaveECG normal distributions.
The WaveECG is based on the median beat activation amplitudes.
The PathECG is based on the electrical pathway as derived by the CineECG algorithm
If no median P wave can be created from the ECG data the percentage bar for the P wave is only a thin outlined empty box.
If no median QRS wave can be determined from the ECG data all percentage bars are presented as thin outlined empty boxes.
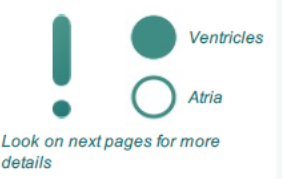 An exclamation mark is shown when the level of conformity with the normal distribution is below a specific percentage.
The dots indicate if the deviation against normal is within the ventricles, the atria or both.
If all values are within normal range no exclamation mark is shown.
If CineECG cannot determine any median beat only page 1 and page 5 will be made available for the user. There will be no exclamation mark visible nor atrial or ventricular dots.
If CineECG cannot determine a median P-wave only pages 1-3 and 5 will be made available for the user. If an exclamation mark is shown this only relates to the ventricle analysis.
If no CineECG report can be produced due to poor data quality this text is shown:
Unable to create CineECG pages due to received data quality
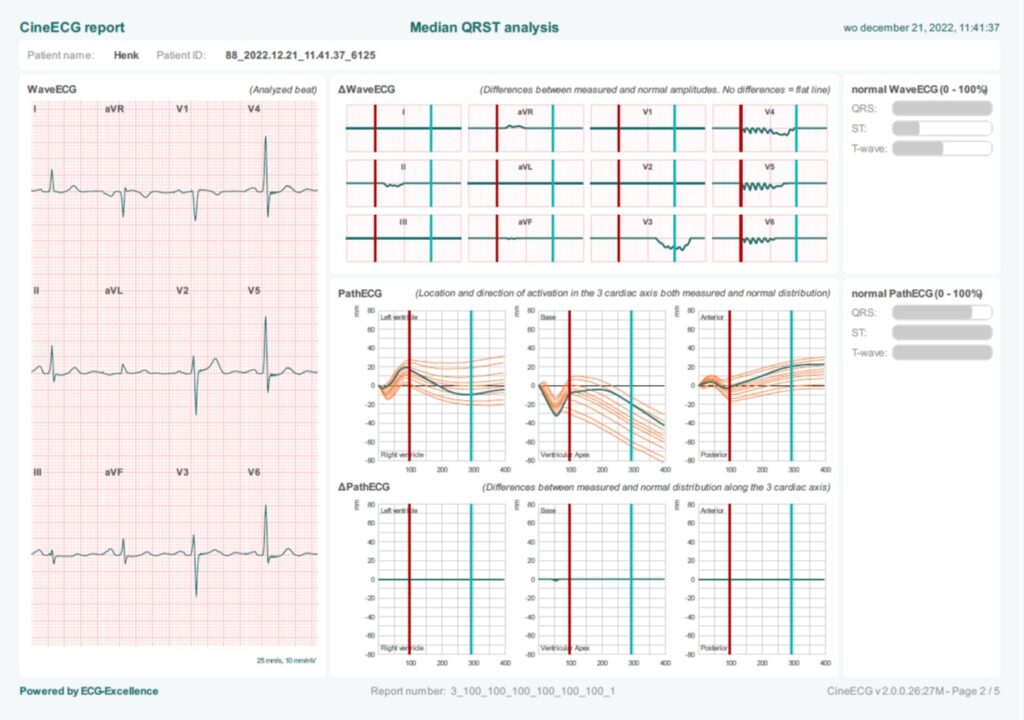
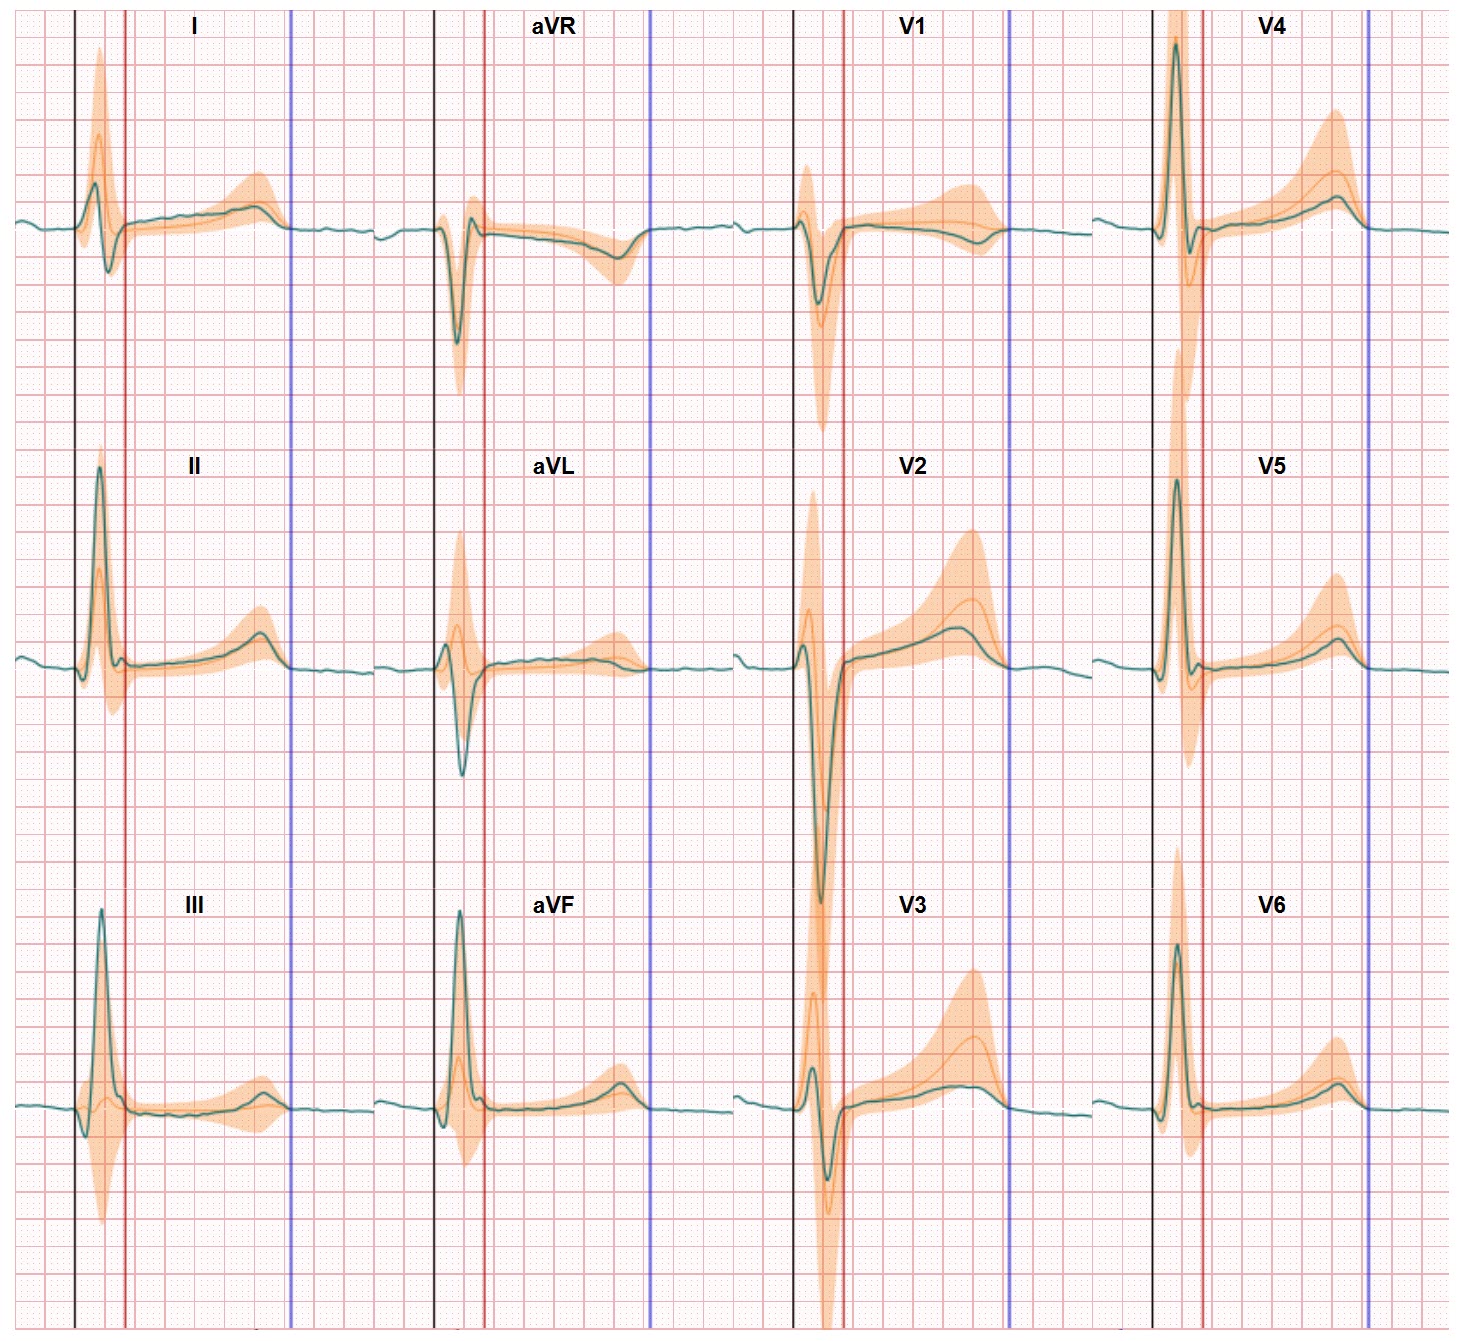
Page 2 shows detailed information regarding the ventricles
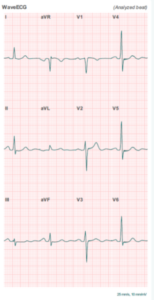 The derived median beat is shown on the left side of the page at standard paper speed on 25 mm/sec is used, and 10 mm / mV.
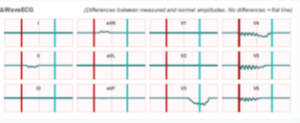 The delta wave map shows the comparison of the median QT beat amplitudes with the mean of the normal distribution of 6000
normal ECG amplitudes (derived from the PBT-XL ECG database containing +23.000 classified ECGs).
If the gender of the person is known the CineECG application applies a different distribution per gender. Only when a deviation is recognized the map shows a amplitude. If a recorded values is within normal the line remains horizontal.
The vertical red line indicates the end of the QRS, the cyan line the peak of the T-wave. The
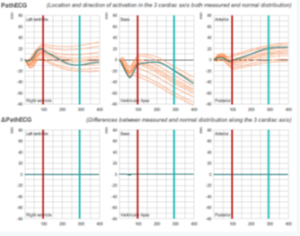 The PathECG is presented in two views:
a 3 axis view in 3 graphs each showing a different axis and combining the recorded value and the bandwidth of the normal distribution (orange lines) during the ventricular activation and recovery process. If for instance the recorded value moves to the bottom of the first graph this indicates the activation moves to the right side of the heart.
The vertical red line indicates the end of the QRS, the cyan line the peak of the T-wave
The delta map view shows the result of the comparison between the recorded value and the normal distribution. Recorded values within the normal bandwidth result in a horizontal line
Percentage bars of the PathECG and WaveECG are copies of page 1
Page 2 is not made available when CineECG is not able to deriving a median beat from the recorded ECG data.
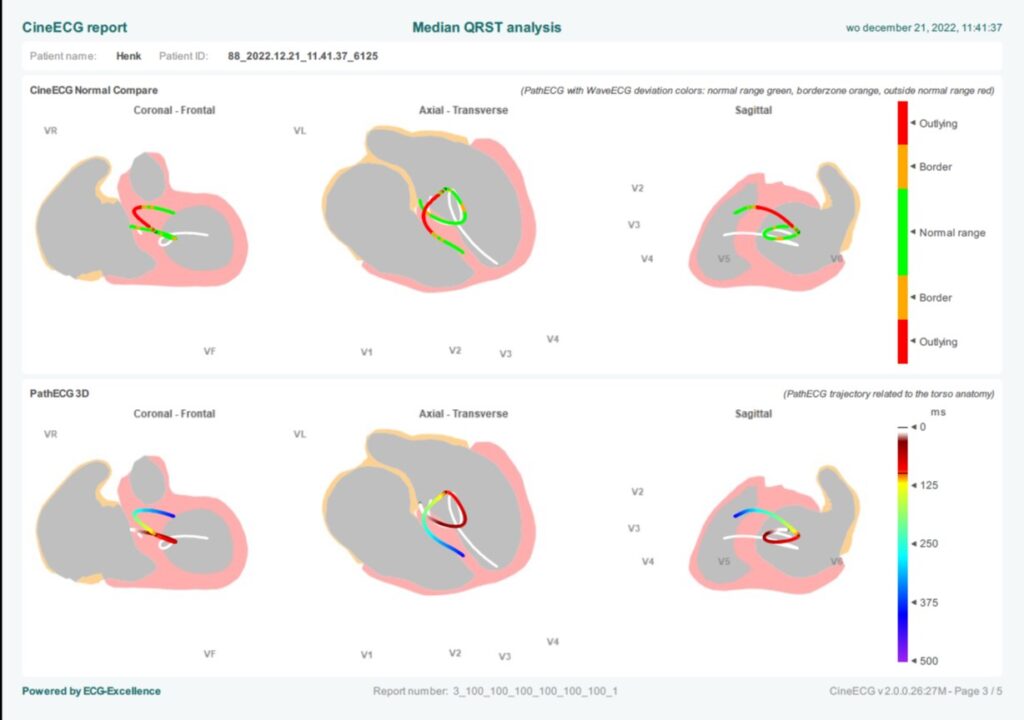
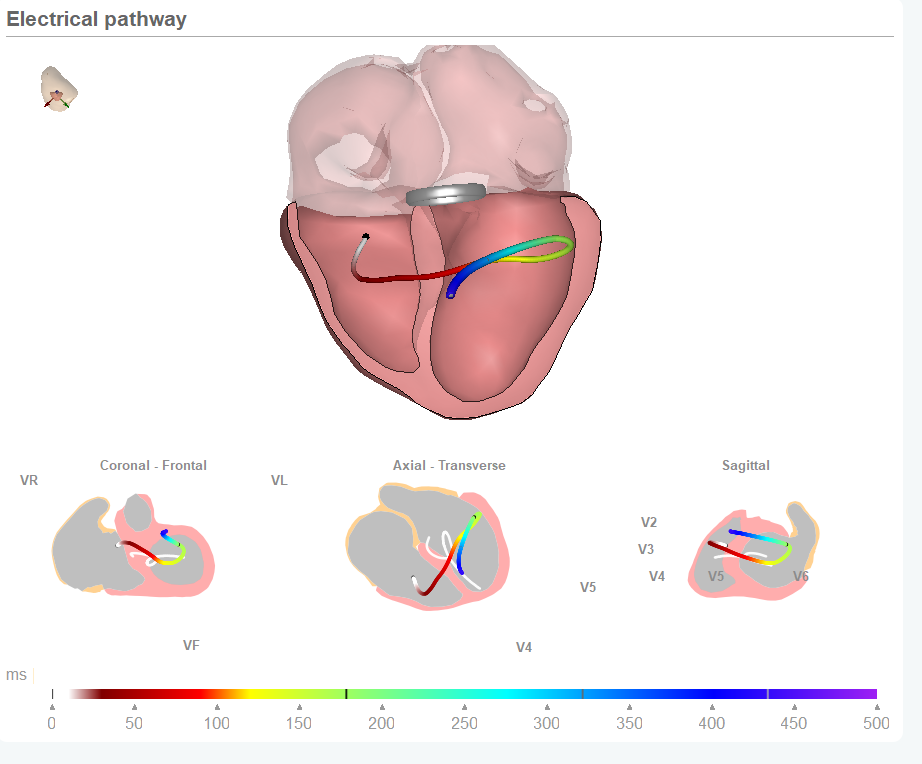
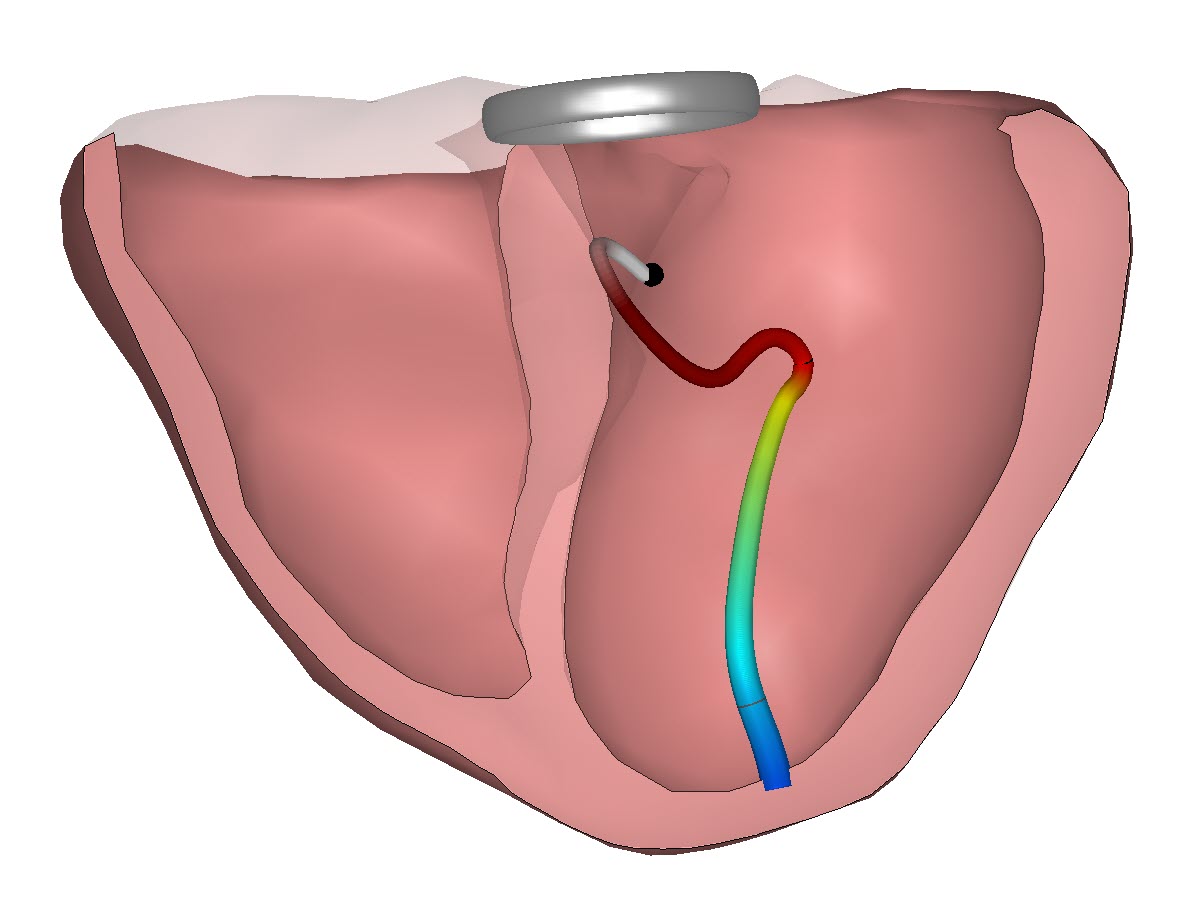
Page 3 shows also information regarding the ventricles but on this page we show the pathway in a 3D model. In all images the white line indicate the normal Path.
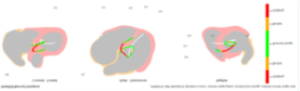 The ventricles PathECG is shown in 3 heart views and in each view the mean normal PathECG is presented as a white line.
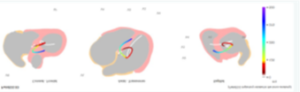 The color of the other line indicates the level of conformity with normal of the WaveECG during the activation cycle. The ventricles PathECG is also shown in its relationship with the heart anatomy and the momentum in the activation and recovery process in the ventricles. The colors represent the time in the QRST sequence, with red the QRS, yellow – green the ST segment and blue the T-wave.
Page 3 is not made available when CineECG is not able to deriving a median beat from the recorded ECG data.
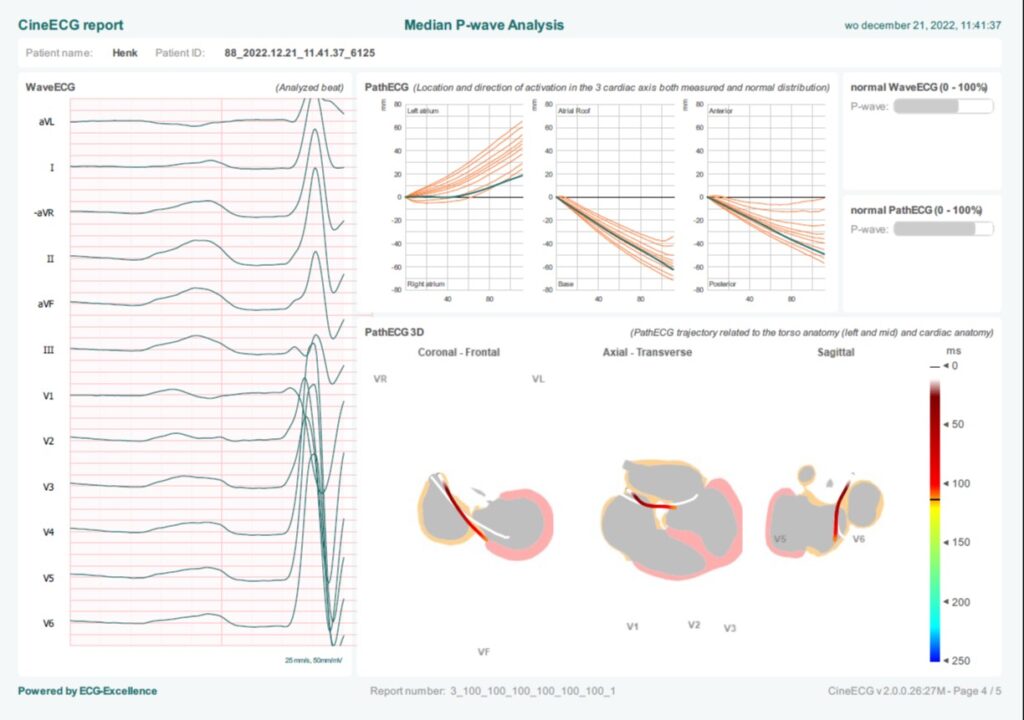
Page 4 provides detailed information regarding the electrical activation in the Atria
 On page 4 again the median beat is shown but with the focus on the P wave segment . The signals are ordered according the Cabrera system. The horizontal lines are drawn at 50 mV/mm
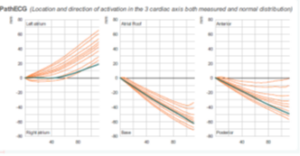 The P wave PathECG is presented in the identical 3 graphs presentation as used on page 2 for the ventricles information.
The recorded value is compared against the distribution of normal P waves Pathways
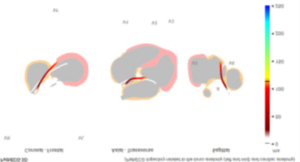 The P wave CineECG trajectory is also shown against 3 heart model views. Again the normal P wave trajectory is presented as white line.
The colors represent the time in the P-wave. A normal P-wave < 120 ms is within the red/orange color range.
Percentage bars on this page are copy of page 1
Page 4 is not made available when the median P wave cannot be derived from the recorded ECG data