Ever since the 12 lead ECG was introduced in the medical domain a key question is how to ensure anyone can interpret 12-lead ECG.
With anyone we mean of course medical professionals but over the decades 12 lead ECG interpretation has remained a major challenge.
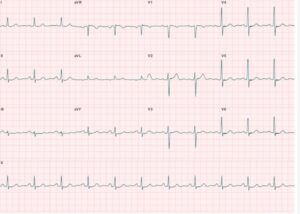
Just imaging you have to read and interpret a set of 12 graphs each representing a different view on the heart during an activation and recovery cycle to understand what’s going on.
And the ECG output is, despite that that the ECG data recording has converted to digital, more or less analog in nature. 2D graphs on paper, that’s almost all you get to work with. The duration of activation process the graphs represent is short. As for the heart rate and rhythm a dedicated so-called rhythm strip is presented next to the 12 lead graphs.
The ECG graphs are not very clear in resolution, subtleties are not visible and you have to rely on the software embedded in the ECG recorders for allocating the measurement points within the graphs to support the heart rate and heart rhythm measurements. It’s a known fact these software solutions also differ per ECG machine brand so the accuracy is again an issue.
No wonder the average accuracy percentages for ECG interpretation are relative low among medical professionals. And no wonder additional cardiac diagnostic instruments are often used to provide more information for decision support.
Much more information available in ECG data
In our quest to change the landscape of non-invasive cardiac diagnostics we have developed new technologies to make ECG interpretation better and easier.
By relating the ECG data (captured by standard ECG recording devices) to the heart anatomy we support the physicians who have to make this conversion themselves until now. This way we present the mean electrical pathway of activation and recovery through the heart. And we combine this pathway with the bandwidth of electrical pathways of normal classified ECGs.
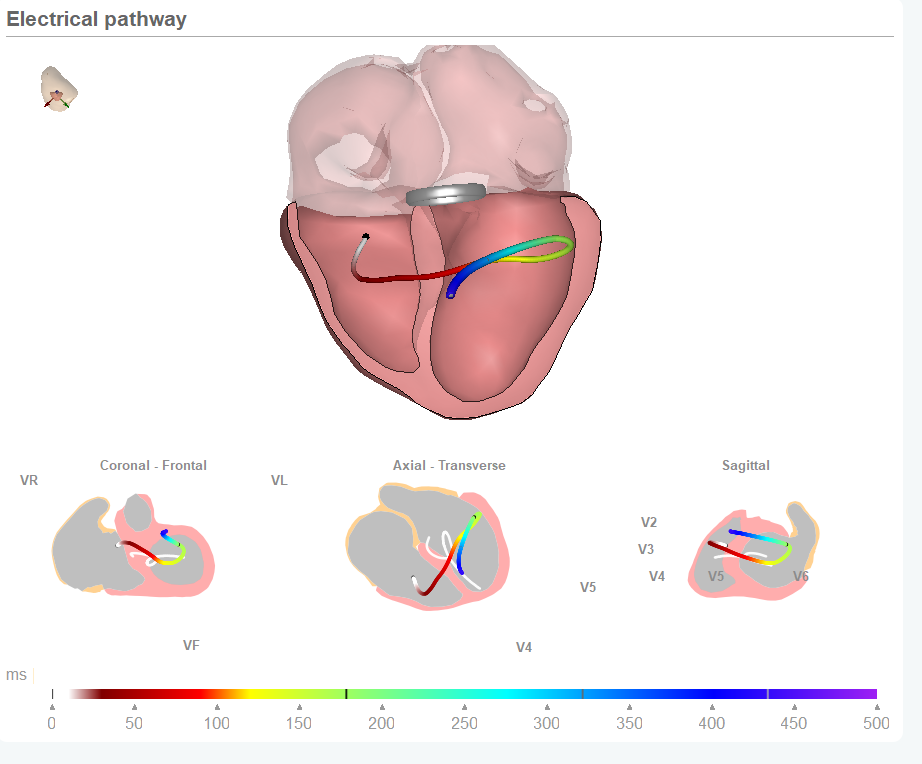
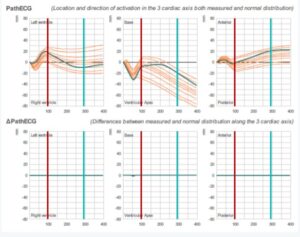
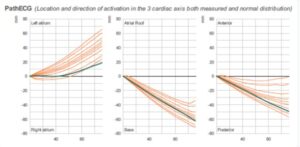
The result is you only tneed hree graphs which represent the position and direction of the electrical pathway in three heart axix.
And is this particular case the recorded pathway is within the normal bandwidth. This is also shown in a so-called delta map view. In this view the graph shows flat lines if the recorded values are within normal.
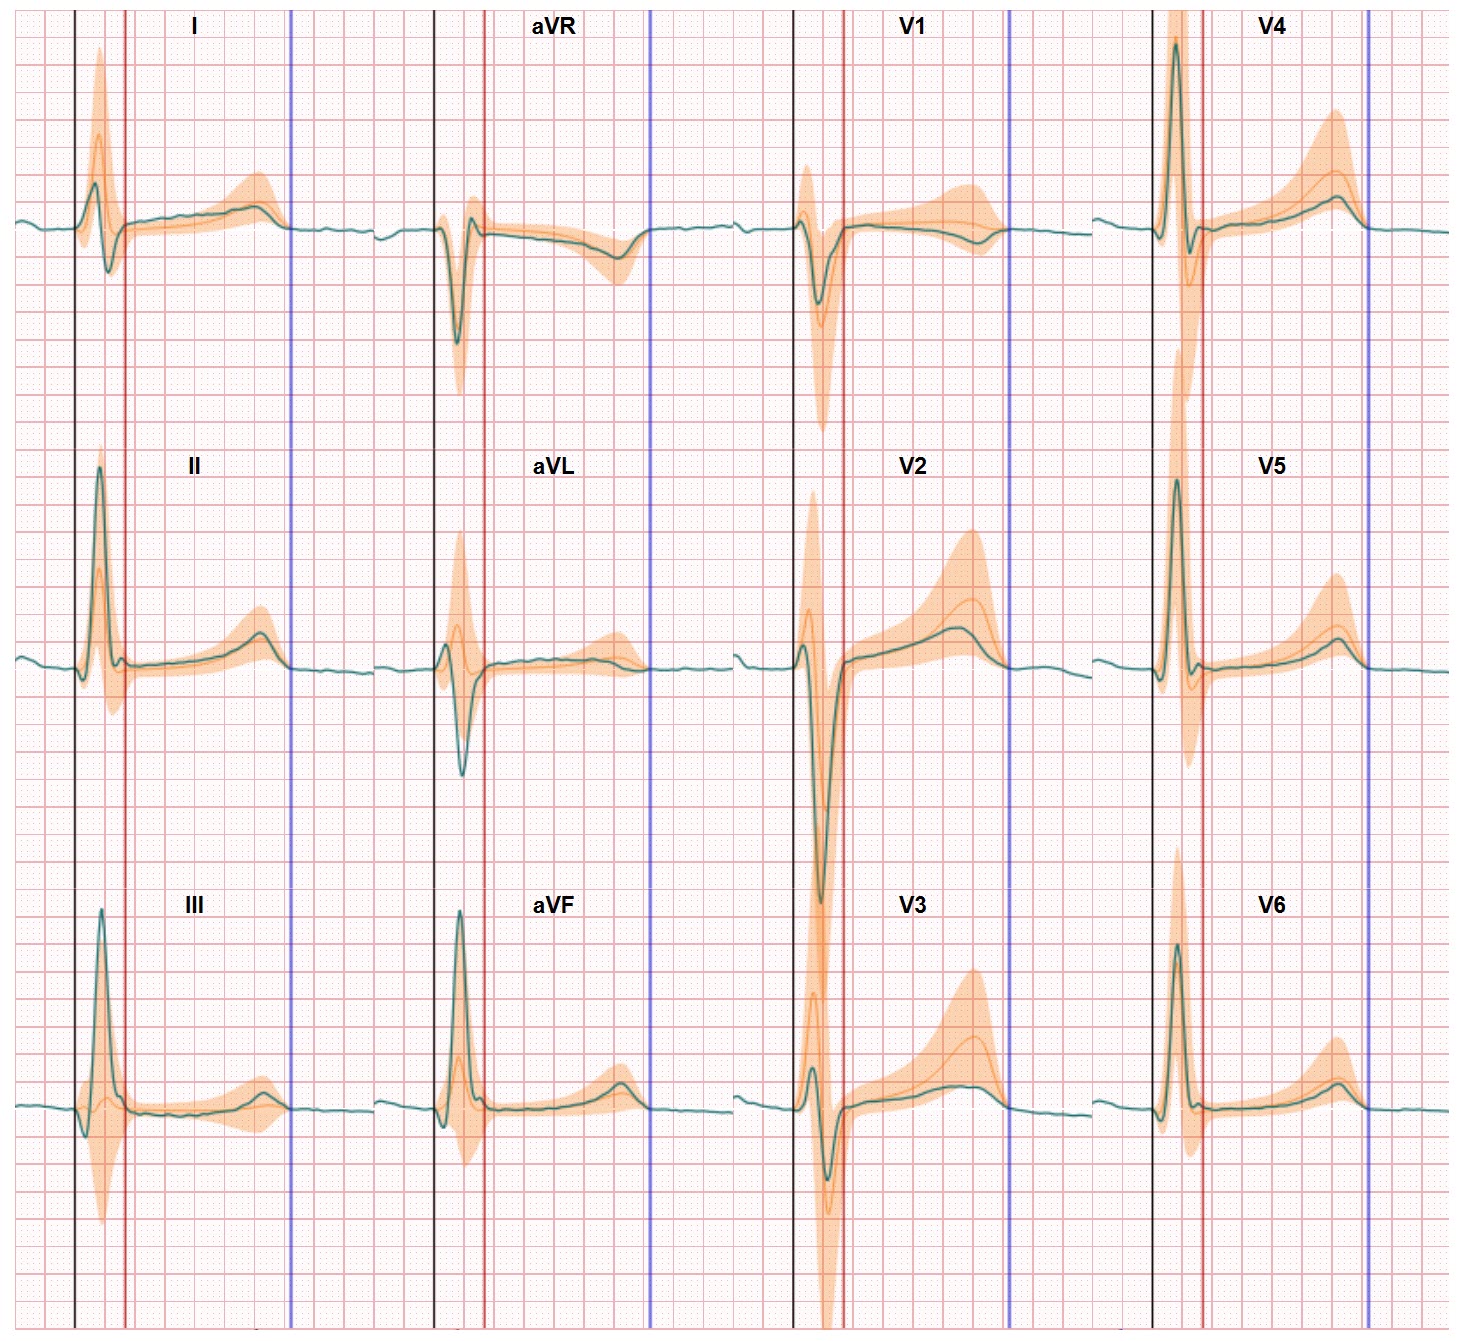
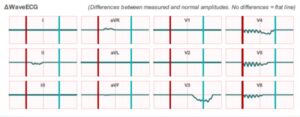
The technology also delivers a similar comparison against normal for the 12 ECG lead graphs.
This result is also shown in the delta view and indicates in which lead a deviation against normal occurs (if any) including the position/direction/magnitude of the deviation. In this particular case there are some deviations, especially in the ST segment and the T wave.
Combined the application shows the electrical pathway through the heart in a number of heart views
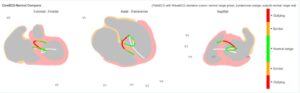
The image of the three heart views shows the mean activation both recorded and normal (white line) through the heart. In this case the focus is on the ventricles activation. The color indication in the recorded line relates to the deviation from normal from the amplitudes. This way the image combines two diagnostic views.
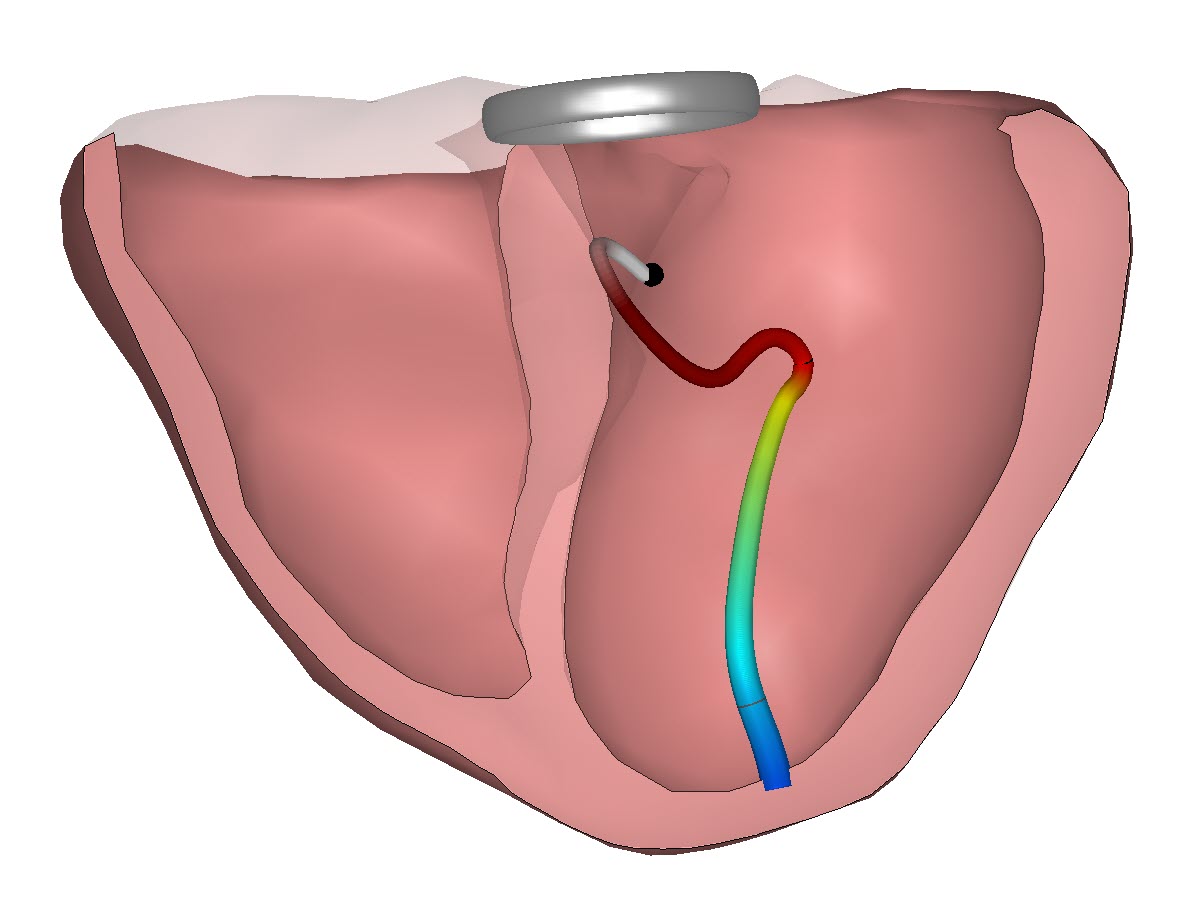
In addition a similar analysis is executed for the atria. The P-wave behaviour follows also a mean activation and recovery path which has a distinct pattern in case of a normal healthy heart performance. The image below shows the electrical pathway of the P-wave in three heart axis.
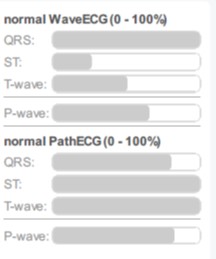
Finally the range of images derived from the recorded ECG data is complemented by percentage bars again showing the level of conformity between the recorded value and the bandwidth or normal ECG values.
Does this imply anyone can interpret 12-lead ECG? Of course not, but providing the additional views supports physicians in easier, better and faster detection of both normal and abnormal ECG performances. Still, you need to be a trained physician and have an effective understanding on the heart and the way the activation and recovery processes work. And you need to understand the basics of ECG technology. But in case of abnormalities the technology provides a lot of detail on the location of the abnormality and the changes in activation and recovery direction. There’s more to see in the ECG. And there’s more to learn on CineECG. For those interested, you can watch a 3 minute video which provides a bit more detail and gives some examples on the difference which are easy to spot in case of abnormalities.