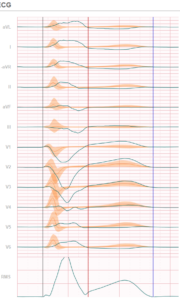
Over the past 100 years physicians have learned to interpret 12 lead ECG data following a strict routine: Rhythm, consistency, conduction times, heart axis check, Morphology checks (P wave, QRS, ST and T wave), compare with former ECG and conclusions. In this Blog we will detail why CineECG analysis is a different ECG analysis.
Overall this approach is quantitative with the measuring times between intervals and segments as main characteristic. And in the morphology analysis the value of the amplitudes is also measured and part of the analysis. Some of the morphology analysis is qualitative in terms of elevated or depressed ST segment (higher or lower than base line) and idem for the T waves.
The standard ECG measurement grid is the base for these time and voltages measurements. Medical professionals are trained to spot the abnormal patterns in morphology and to compare rhythm and conduction times with threshold values (higher or lower than these norms). Yet, this approach to ECG interpretation is not that easy as daily practice proofs.
CineECG tackles the baseline challenge
The basic assumption is to trust the ECG graphs including the position of the base line and the moments within the graph the direction of a graph line is changing to move into a next phase of the activation cycle. From P wave to QRS to ST segment to T wave. Today the ECG recorders have embedded software which allocate these so-called fiducial points. But studies show there is a certain level of arbitrary in this process and each software program may do this allocation slightly different than the other. And furthermore aspects impact the shape and form of the ECG waveforms. Such as the positions of the electrodes on the skin and the relative position of the heart within the patient torso.
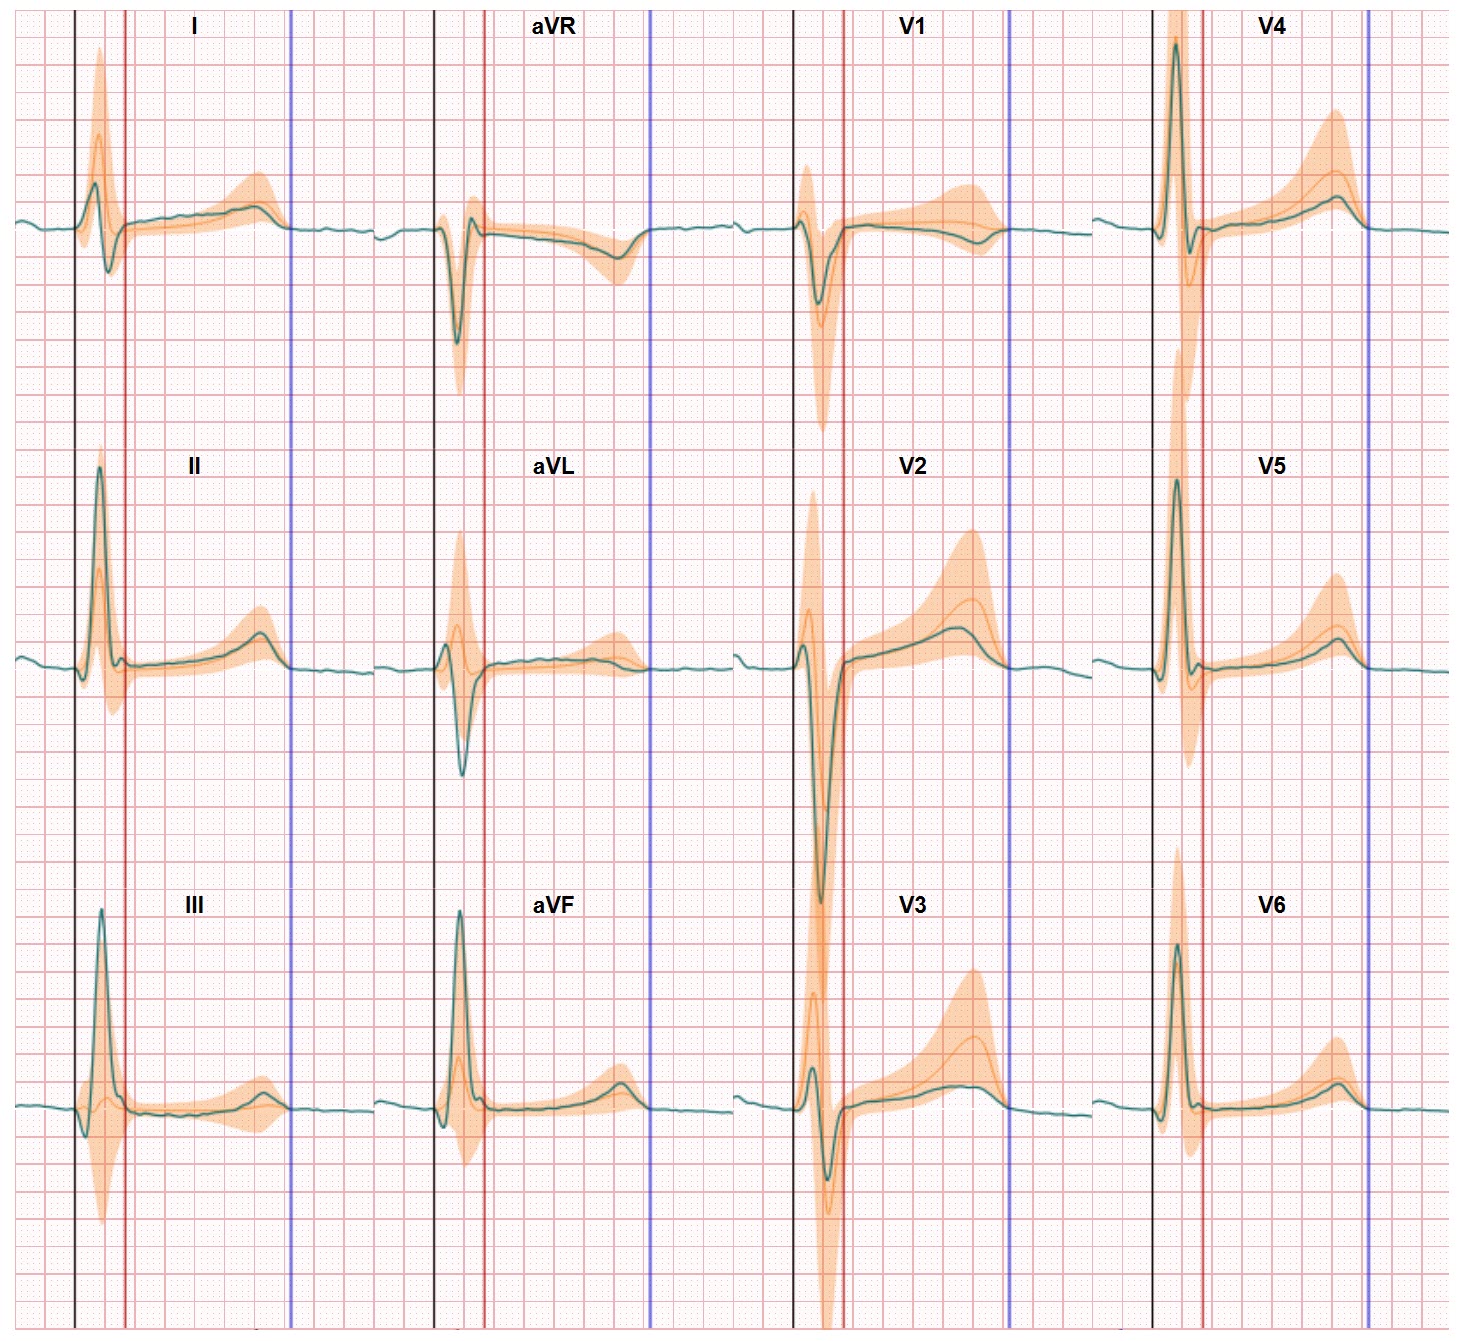
With CineECG we have introduced a (slightly) different approach towards ECG interpretation. CineECG follows the traditional ECG interpretation approaches but CineECG takes the whole ECG waveform into account, not just the timing between certain fiducial points or the peaks (positive or negative) of the amplitudes. And CineECG relates the ECG data to the heart anatomy, making the mental conversion between the standard 2D ECG lines and the activation within the 3D object which is the heart, far more easy.
With this whole waveform approach, and the comparison by CIneECG with a ‘normal’ distribution of normal ECG values, the assessment scope of CineECG is far broader than the standard rule based method.
Decomposing standard 7 steps in ECG interpretation
If we decompose the standard 7 steps in ECG interpretation in relationship to the options CineECG offers the following results:
Step 1: Rhythm measurement in CineECG is similar to the standard approach.
Step 2: Rhythm consistency and variability is similar to the standard approach
Step 2: Rhythm consistency and variability is similar to the standard approach
 Step 3: analysis in CineECG is different but more Conduction effective since CIneECG derives the median beat and compares against the waveform shapes of normal performing hearts. This way also minor deviations from normal are already identified which relate to early phase of conduction disorders. This higher sensitivity results in a more accurate assessment and earlier detection of conduction disorders.
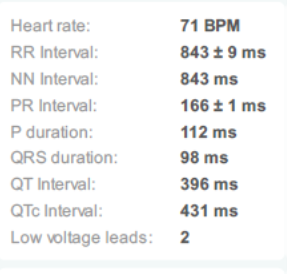
In parallel CineECG also presents the duration time of activation segments which still allows for comparison of these parameters against the norm rules. (see earlier)
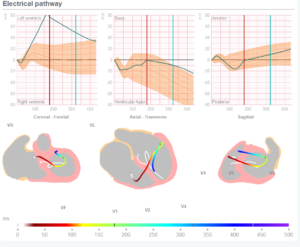 Step 4: heart axis analysis in CineECG is different since CIneECG both presents a 3Dimensional perspective of the heart axis and a continuous (during the whole activation cycle) view of the heart axis. This offers more insight into deviations within the heart axis during the activation process and supports physicians in understanding the why of deviations in the heart axis
Step 5 Step 6 and Step 7 are morphology analysis on P wave QRS and ST. CineECG id different in this analysis. CineECG relates the ECG waveform data to the heart anatomy and compares the whole waveforms against a normal distribution of waveforms of normal performing hearts. (see graphic next to step 3)
Next to the check regarding abnormalities in conduction parameters (which are captured by the comparison against normal) all differences in ECG waveforms against normal are part of the assessment.
And where in the traditional method ECG evaluators are focused on spotting abnormalities based on the recognition of abnormal patterns, CineECG looks for the differences against normal.
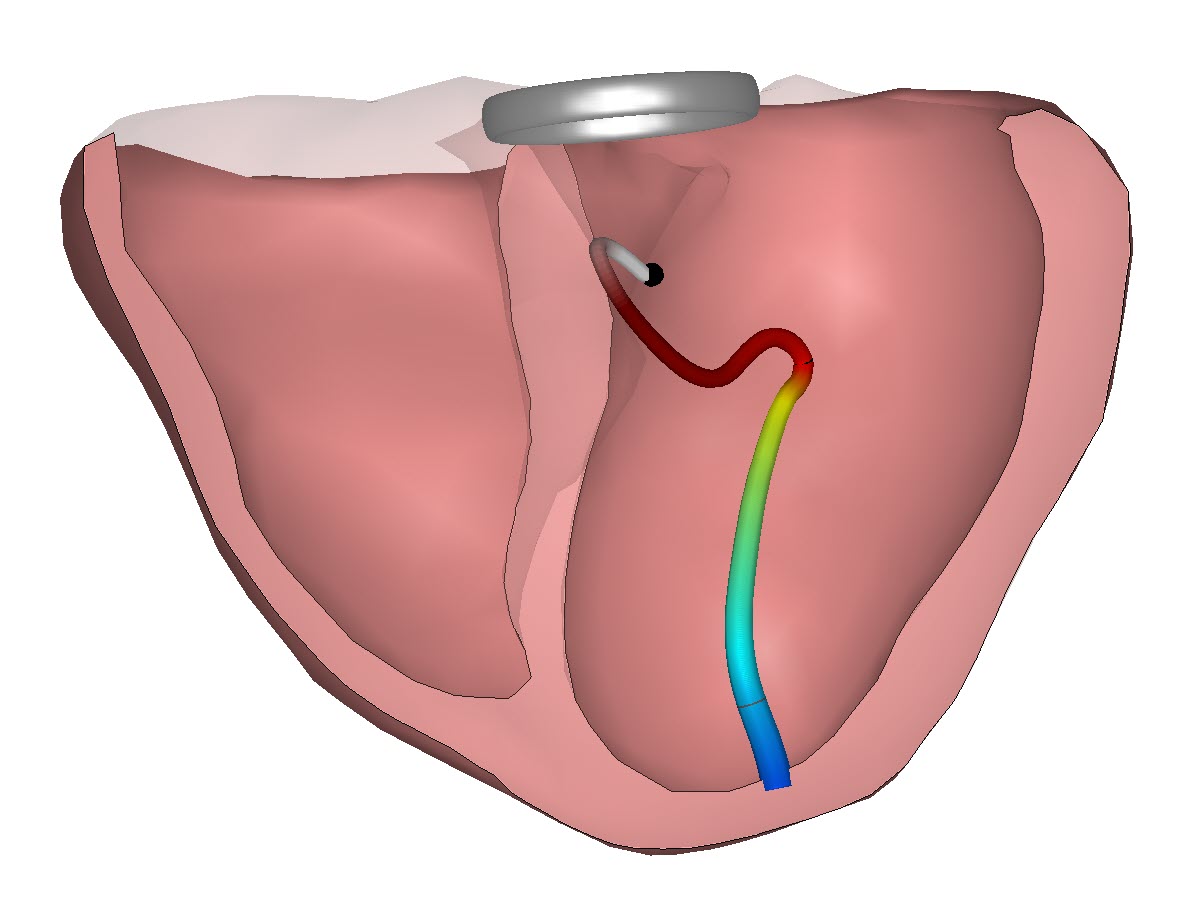
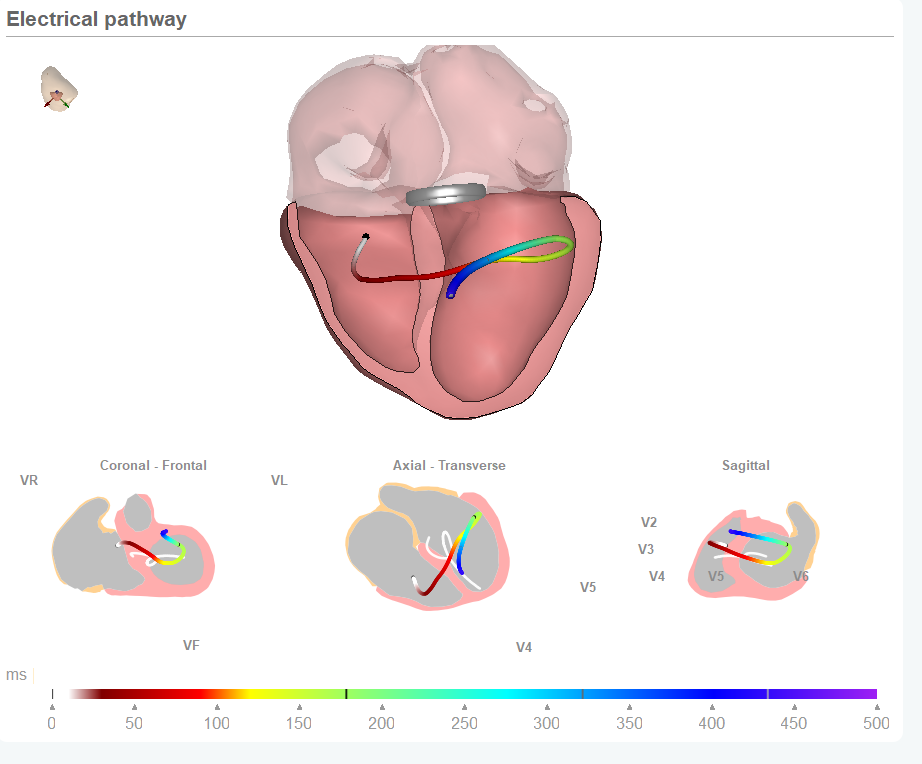
Using this method results in a far more accurate assessment also in the low potential difference parts of the activation cycle. And it provides the opportunity to use gender specific ‘normal’ distributions (males, female) to further increase the patient specific accuracy. Since CineECG relates the ECG data to the heart anatomy it is also possible to describe the electrical path in 3 dimensions (which is a moment by moment reflection of the heart axis or vectors during the activation cycle).
And in 2D anatomical models in which the normal electrical path is displayed as a white line. This supports the effective comparison between patient data and normal heart performance. But is also visualizes which part of the heart is demonstrating an abnormality.
This feature of CineECG has proven to be very effective in identifying infarcts and the origin of these infarcts.
In addition to these 7 steps a physician can compare a former ECG with the new one of the same patient. This may help to identify risk changes (for instances did a Left Bundle Branche block occur earlier as well). CineECG may be helpful here as well since the comparison against normal is a standard feature and changes are easy to identify with CineECG.
As a result CineECG is a different ECG analysis, providing more views regarding both the relationship with the heart anatomy and normal ECG profiles. And thus a consistent high accuracy in making the distinction between normal and abnormal but also true support for non ECG interpretation experts in there clinical management decisions.