By Introducing CineECG Demonstrator ECG Excellence provides a free downloadable interactive view on how 12 lead ECG interpretation can be so much easier and delivering better results.
Much needed since over the past 110 years 12 lead ECG waveform interpretation has remained a major challenge for both Healthcare practitioners and even ECG experts.
Recent meta studies have indicated the struggle to correctly interpret an ECG output is there between all kind of expertise levels. And learning to become an expert requires many thousands ECGs to assess. Much more hours than the average healthcare practitioner gets in their base training.
Hundreds of books and training courses and video tutorials are available to support addressing the interpretation challenge.
The classic 4 x 3 waveform presentation (complemented by the rhythm strip) presents a low resolution graphic output in which subtilities are difficult to spot. Most physicians are trained to mainly look at the rhythm parameters (supported by the software embedded in the ECG devices) and for this purpose the rhythm strips provides the information. Regarding the waveforms we look for significant deviations in the ST segment and T waves and that’s about it.
.
The ECG waveforms however embed a wealth on information on how the activation flows through the heart and this requires for an ECG reader to mentally convert the 12 graphs into a 3D image of the heart activation. This is a diminishing skill or art. Another significant complication in ECG interpretation is the lack of a ‘normal’ standard. This forces the ECG interpreter to look for significant deviations in the ECG waveforms.
CineECG is a new solution for ECG interpretation support. By introducing CineECG Demonstrator we now offer the option to experiment and experience yourself how 12 lead ECG interpretation can be so much easier and better.
New views support easier and better ECG interpretation
CineECG combines 3 type of views for the same ECG data set:
- The classic view combining the 4*3 ECG graphs, rhythm strip and interval measurements
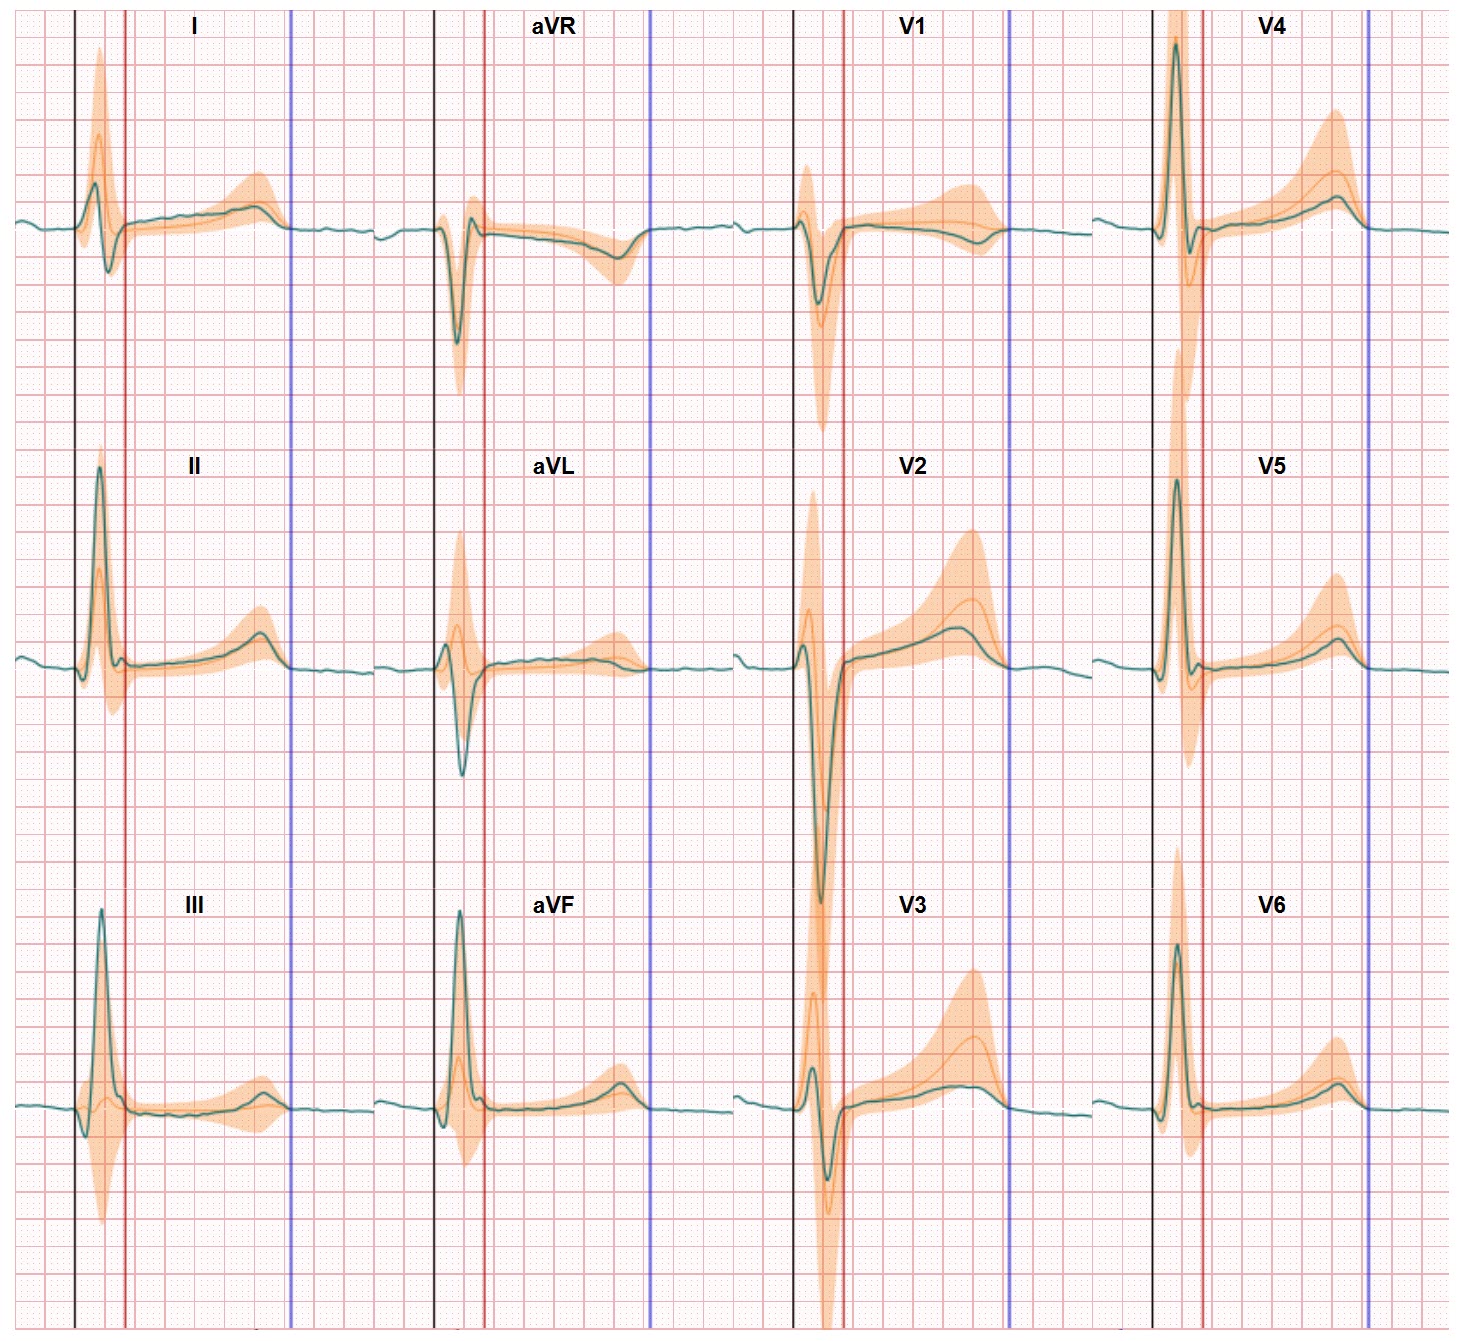
- The comparison of 12 lead ECG waveforms with a bandwidth of normal ECG waveforms (normal distribution). This comparison makes CineECG much more sensitive for identifying deviations from normal and the comparisons are categorized in 4 activation segments (P wave, QRS, ST and T wave. CineECG presents the comparison through new graphs and percentage bars
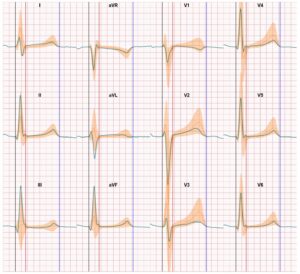
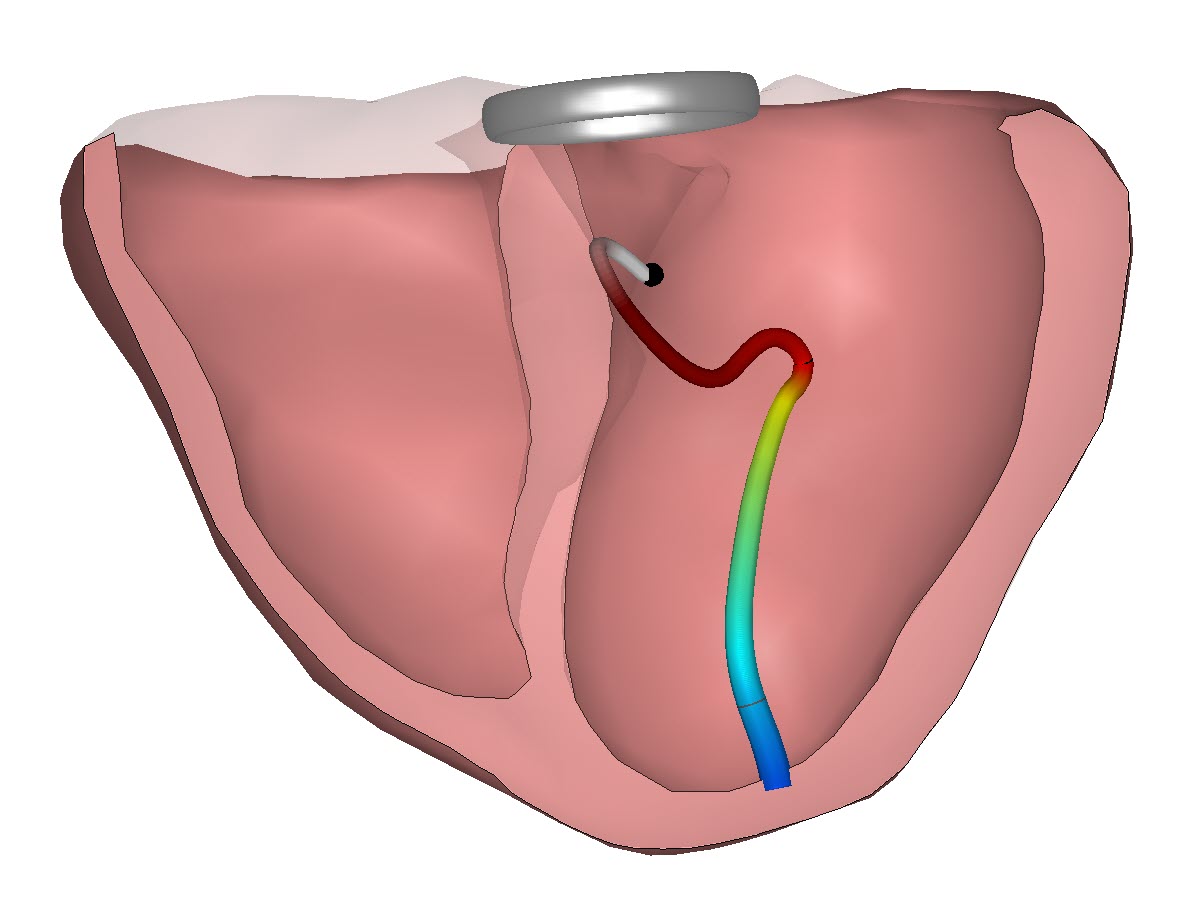
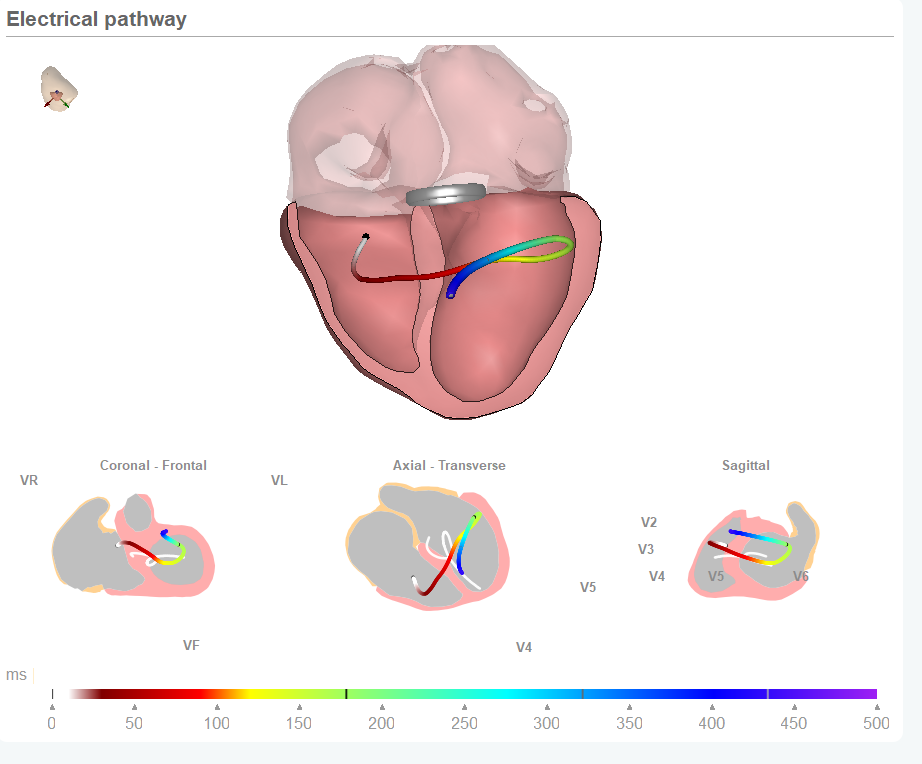
- The introduction of the mean activation related to the heart anatomy. CineECG visualizes how the direction and position is of the activation at each moment during the activation and recovery cycle. As with the 12 lead Graphs CineECG compares the recorded electrical activation path with a normal electrical pathway which is based on thousands of normal classified ECGs.
The combined power of these three views delivers an ECG interpretation method which is easy to understand and apply, identifies deviations from normal earlier and easier and this way supports identifying difficult and ‘hidden’ disorders.
With introducing CineECG Demonstrator we also provide a number of ECG cases (ACS, conduction disorders, Normal ECGs) in an interactive setting in which the user can select cases, views (Ventricles, Atria, 3D, 2D, Vectors, leads, yes or no coronary arteries), base line settings, modus (static or dynamic) and much more
With introducing CineECG Demonstrator we also provide a new fresh interface of ECG interpretation.
CineECG Demonstrator is free. You can download it via our website and this link.
It is not a clinical tool, you can not import or export ECG cases. But we welcome feedback and tips and advice to further improve this first glimpse of the future of 12 lead ECG interpretation.
