In this ECG case study we describe the advantages of using CineECG for the following case: male 70 yrs with Left Bundle Branche Block. Physicians deliver great jobs in identifying cardiac disorders from interpreting ECG waveforms. For this purpose they are trained in recognizing cardiac disorder patterns which relate to specific diseases and heart conditions. On average a lot of training hours are required to get a grip on the matter. There a many area’s in the heart which can cause health issues and often ECG waveform patterns relate to range of these issues. This is part of the ECG interpretation challenge, With introducing CineECG supported interpretation we want to present a new way of processing the ECG data to make 12 lead ECG interpretation more accessible to a larger group of physicians. And with less training hours required. In our first case we present a 70 year old male with a potential conduction disorder.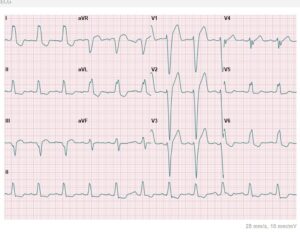 For some physicians the LBBB is already visible in the standard ECG output but experience learns a lot of physicians still require some time to study the ECG data and in their minds relate the waveforms to the anatomy of the patients heart to understand there’s a different activation process going on than can be expected in a normal performing heart.
The CineECG software works with the same ECG data and does two main things in addition: A) it relates the ECG data to the heart anatomy and shows the average electrical pathway of the activation and B) it compares the waveforms with a normal distribution of normal performing hearts (derived from thousands ‘normal’ classified ECGs (PTB-XL database).
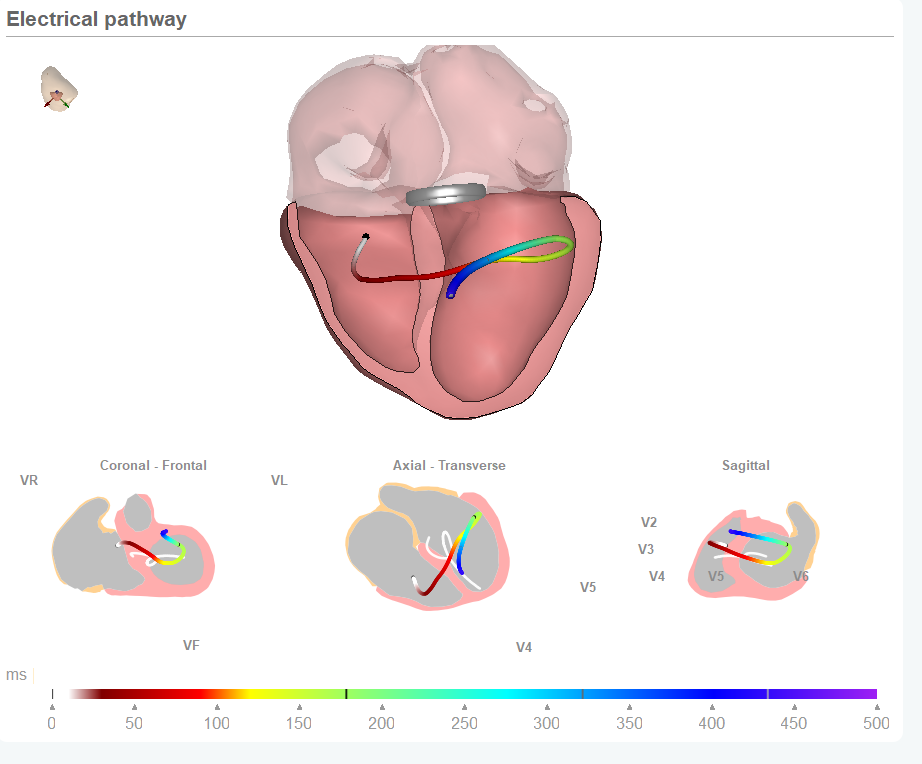
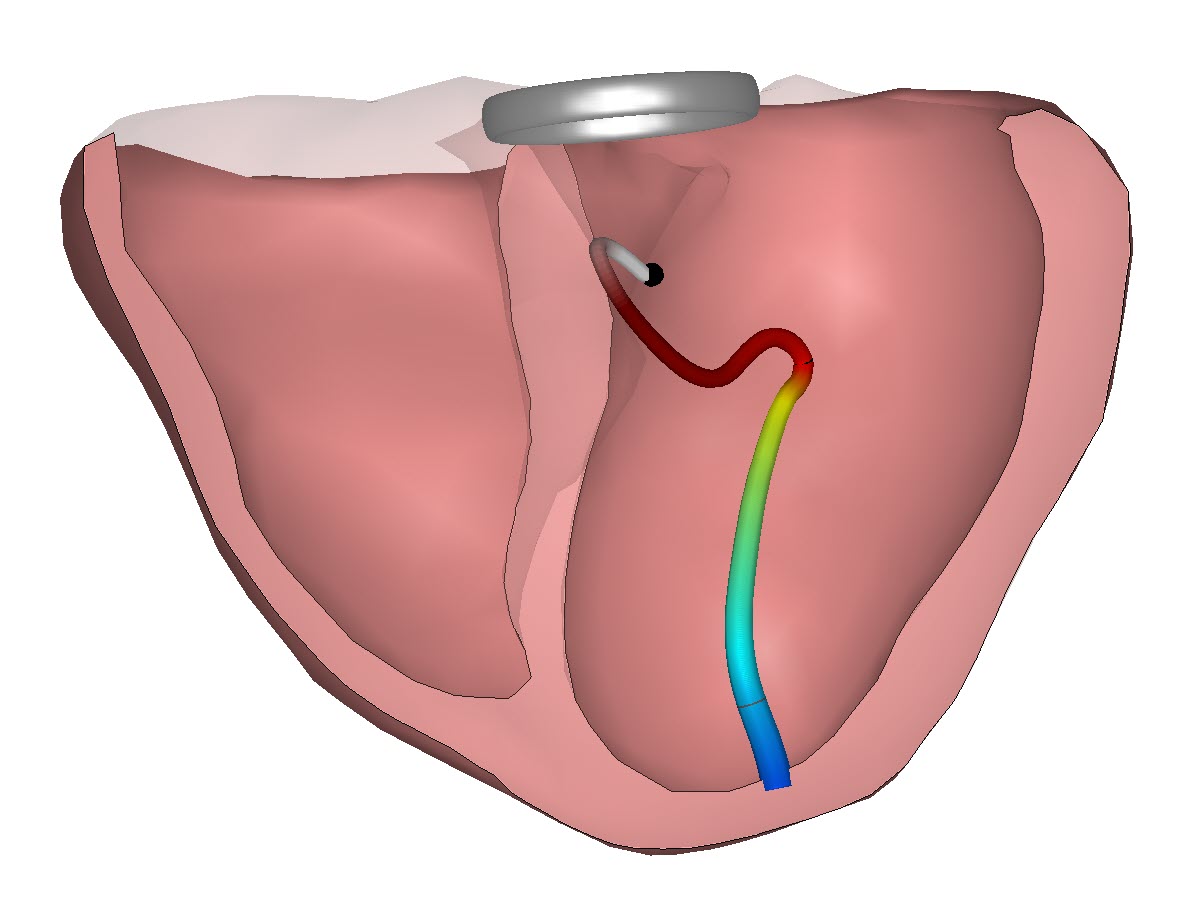
CineECG shows the LBBB electrical pathway
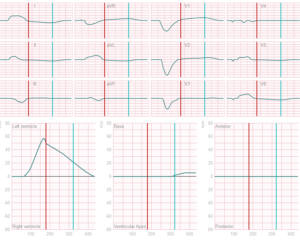
For an LBBB situation the CineECG electrical pathway shows a very specific pattern: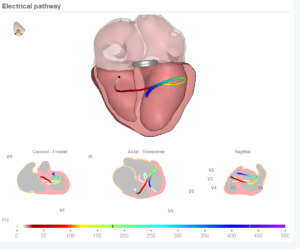 it starts in the right chamber, going initially to toward the apex and the to the left free wall. This pattern is different from the normal pathway which is presented as a white line in the CineECG views on the heart pathway.
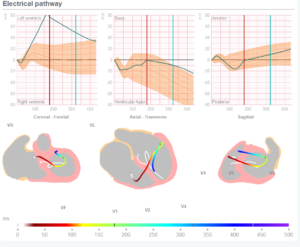
And the comparison against the normal distribution of normal electrical pathways is also presented in graphs which show the electro- anatomical position and direction. Especially in the graph which shows the movement from left to right the LBBB situation is clearly manifest.
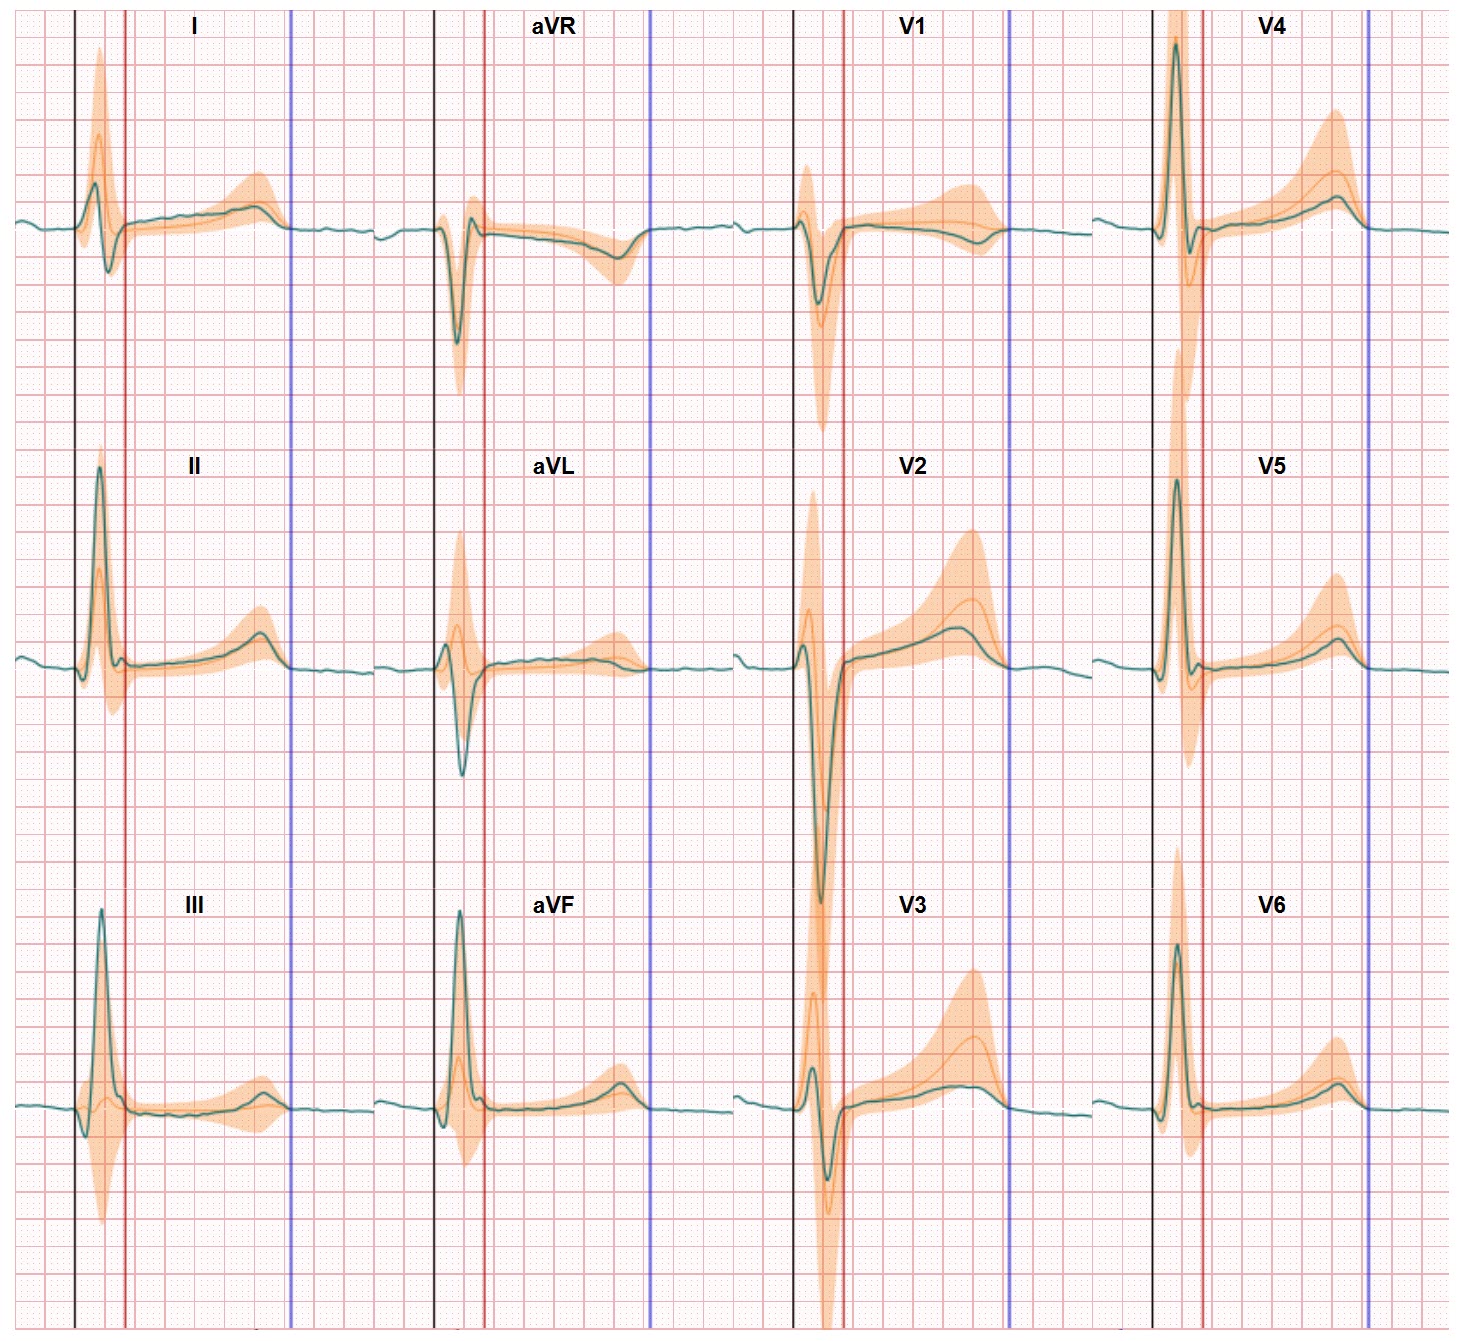
CineECG also compares the waveforms against normal
CIneECG presents the comparison against normal distribution for each lead.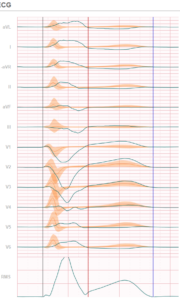
In this LBBB case the differences against normal are obvious and easy to detect (compared to a standard 4*3 graph presentation without the normal distribution presented.
In this case the differences against normal occur in all leads. In other disorders (future cases we will address) these differences are often much harder to detect.
In the CineECG analysis we therefore also add a quantitative analysis of the percentage within normal per activation segment. 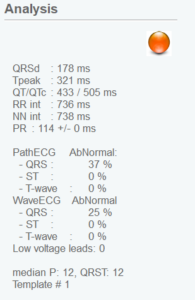 In the image shown for this case (Male 70 yrs with Left Bundle Branche Block) QRS, ST and T-wave percentage bars are shown, both for the electrical pathway and the wave.
In addition to the views presented above CineECG also shows so-called delta map views. These views combine the normal bandwidth and the recorded patient data and only show a deviation from a flat line if there’s a segment out of the normal range.
This way a CineECG report provides a range of views, all developed in collaboration with leading cardiology experts to meet their range of requirements. With this LBB example we have presented an easier (Cine)ECG interpretation case. We enjoy feedback. And if you want a closer look into this case you can use the CineECG demonstrator which is freely available via the www.CineECG.com website.
