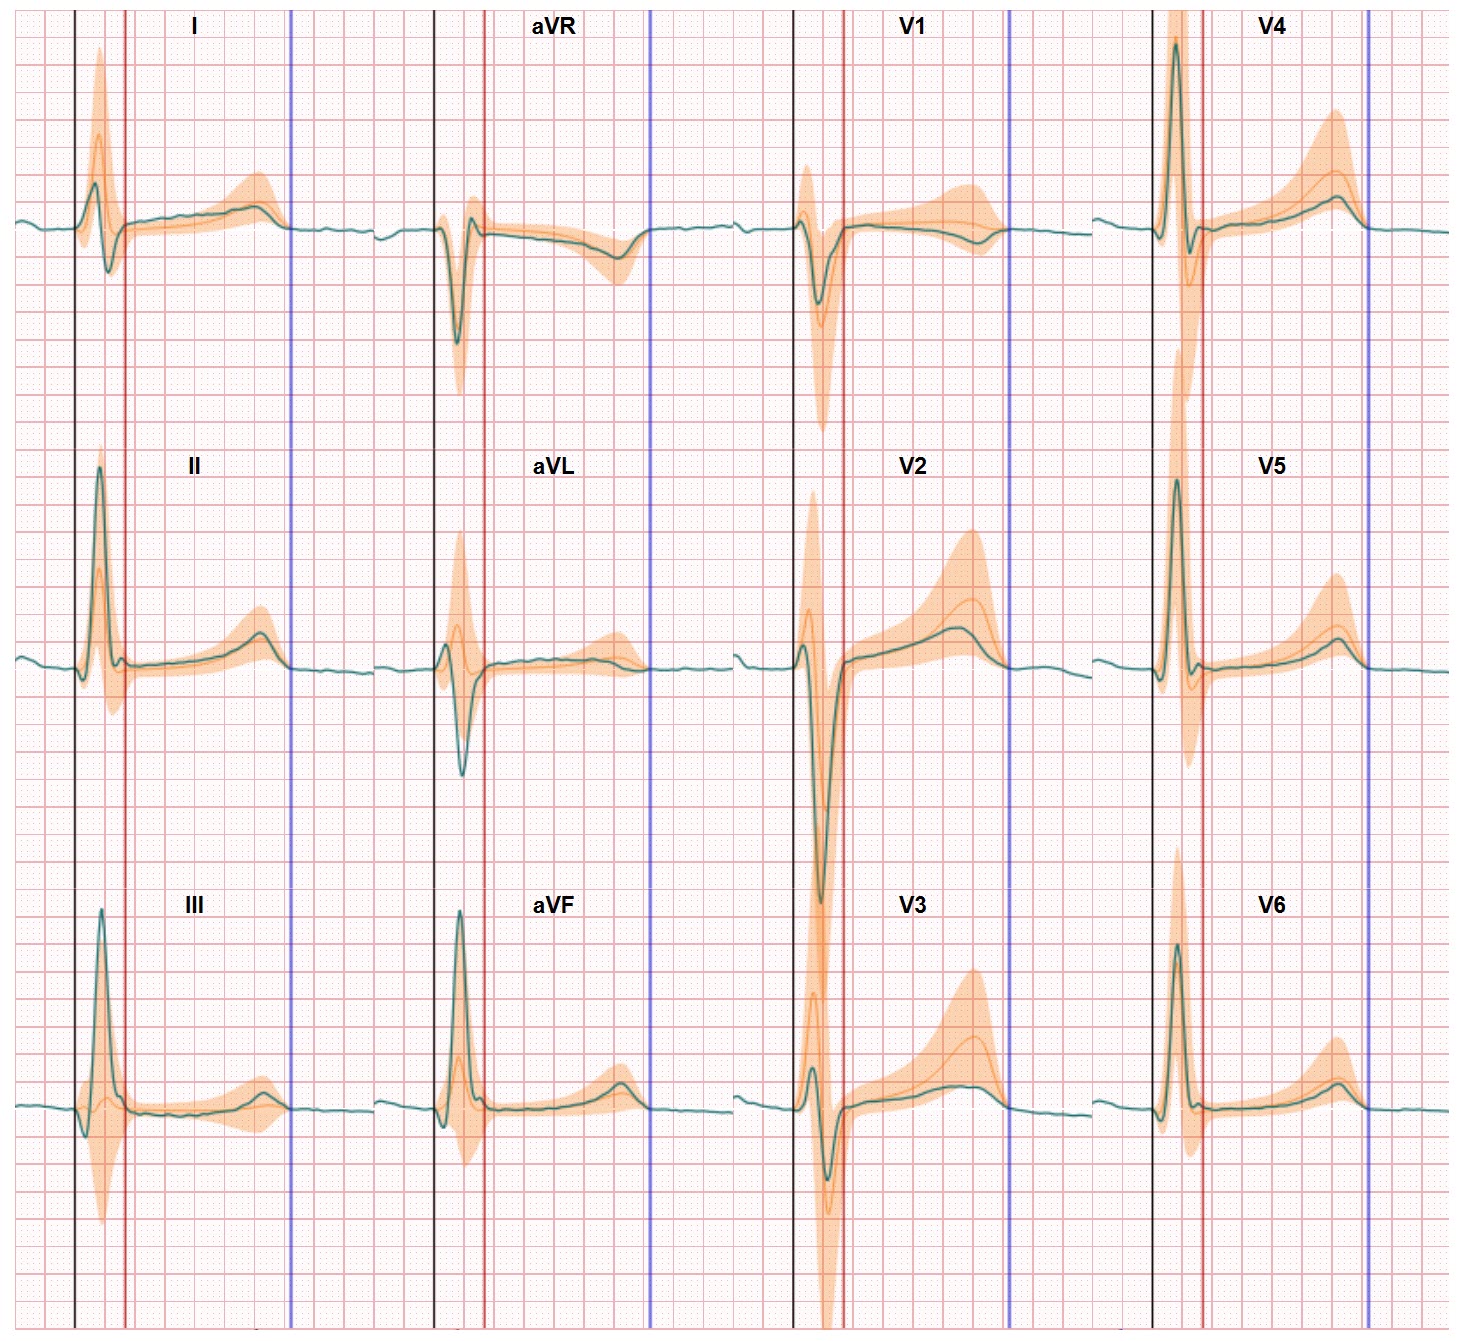
Most people are familiar with the ECG as an instrument to register the heart rhythm. For this purpose, only 2 electrodes placed on the skin are sufficient to get an effective measurement. But the ECG also registers the conduction in the heart tissue. The heart activation cycle produces a electrical current which flows through the heart and activates and relaxes the heart muscles. The ECG waveforms reflect this electrical activation process. In the 12 lead ECG physicians use 10 electrodes which need to be placed at specific locations on the body to record 12 different segments of the heart. These segments are presented in graphs to the cardiologists and the analysis of the ECG waveforms is the cardiologists focus.
Unfortunately, the ECG waveforms shapes are impacted by the electrode positions on the skin, the heart orientation (the way the heart is positioned within the body) and the conduction of the body tissues between the heart and the electrodes. In day to day ECG practice the combination of the variabilities in these impact factors results in unclarity regarding the interpretation of the ECG waveform. Format and amplitude can only be evaluated from a broad perspective and the more detailed information, hidden in the ECG data, is ignored. Due to the variabilities in electrode positions and heart orientation the ECG baseline position can not be determined and the ECG waveform value (either plus or minus) is difficult to asses near the baseline. The waveform values however indicate the direction of the electrical activation. This limits an effective heart conduction assessment especially in the segments of the activation cycle in which the electrical potential differences are small.
ECG Excellence has based its technologies (including CineECG) on applying inverse cardiac modelling. In this technology we apply a digital twin approach using computerized anatomical models of the heart and the surrounding tissues. The perspective of these models is the electrical activation of the heart and the electricity conduction of the tissues. CineECG reconstructs the electrical conduction in the heart from the 12 lead ECG data by combining the computerized anatomical model, electrode positions on the skin, a heart-torso relationship which positions the heart within the torso with the 12 lead ECG data.
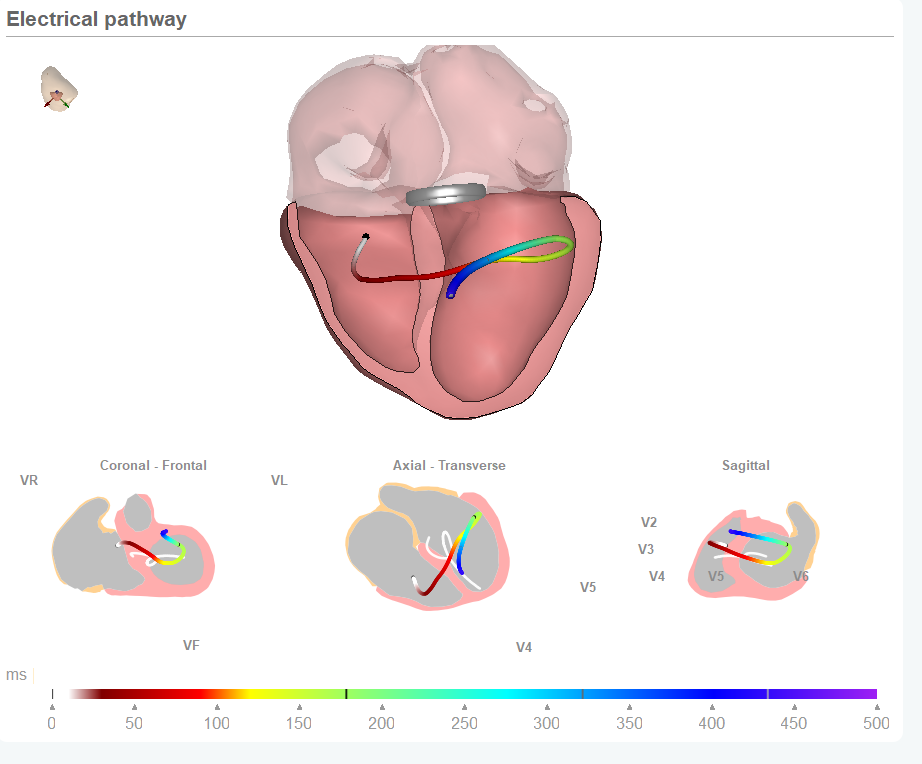
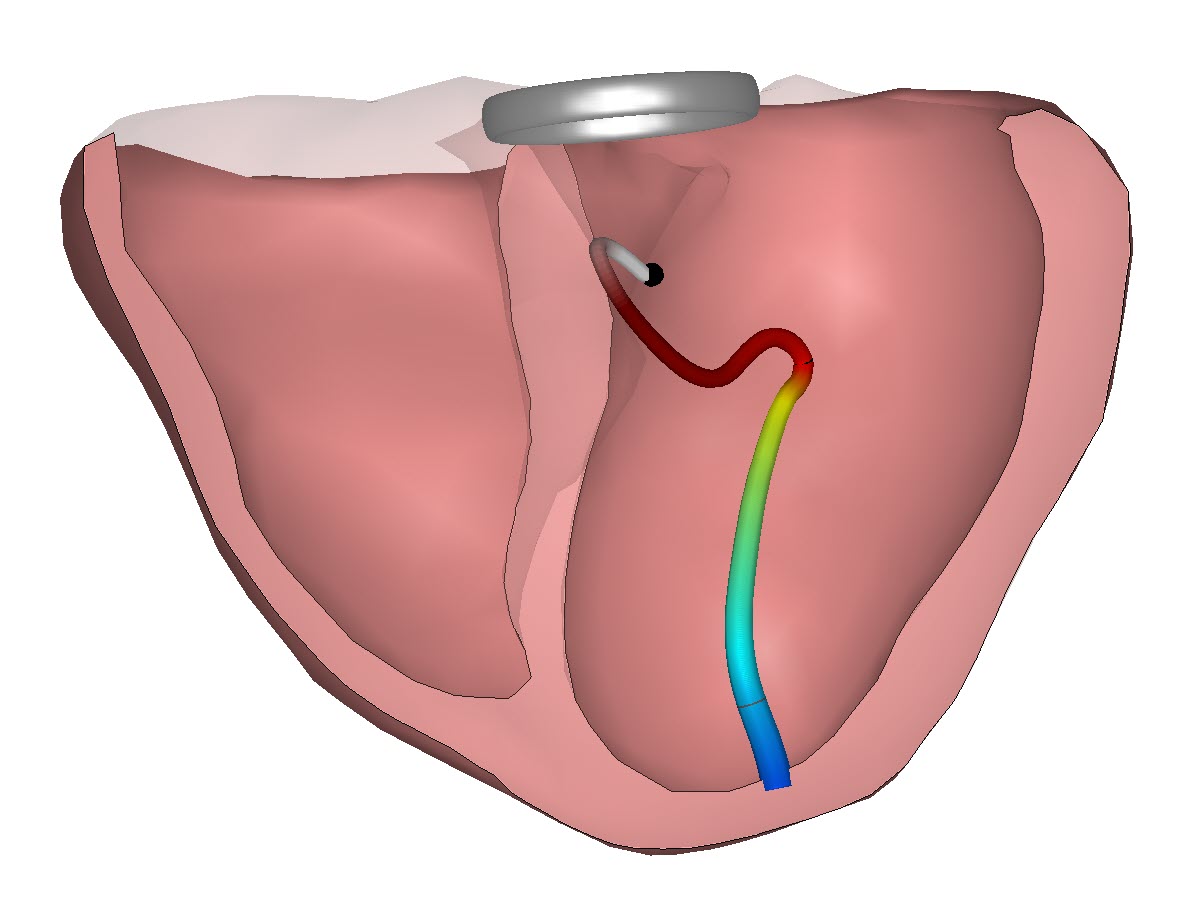
This way CineECG is able to related the ECG data to the heart anatomy. CineECG furthermore bundles the heart activation and derives an average electrical pathway through the heart chambers. This electrical pathway shows the average position and the direction of the bundled electrical pathway during the activation and recovery cycle of the heart.
This way CineECG is able to present the recorded ECG data in only 3 axis which show the electrical pathway from left to right, from top to bottom and from back to front in the heart.
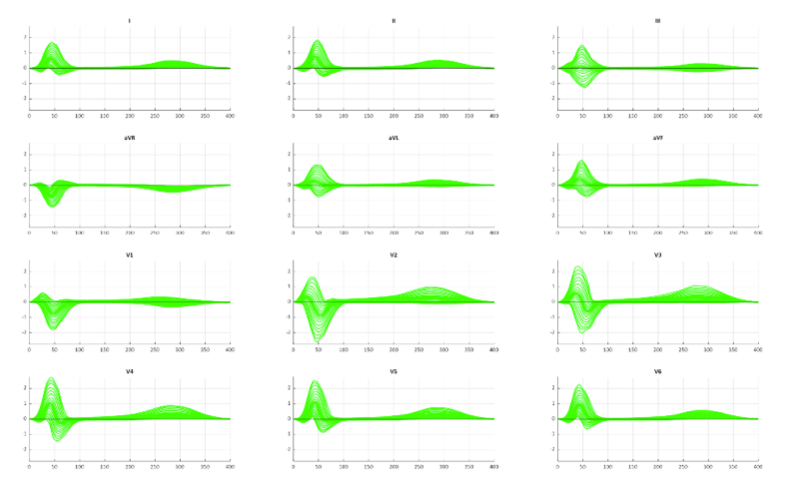
Since we have processed plus 6400 ECG data sets of healthy people we are able to present the recorded (patient specific) CIneECG with the bandwidth of CIneECG values (location and direction) of these normal patterns.
CineECG shows the level of conformity between the recorded data and the normal bandwidth both for the QRS segment as for the ST segment expressed as a percentage and expressed in a traffic light colour system in the CineECG graphics.
The output is reflected in both the visual representations on the CIneECG report and in the parameter values in the report:
|
CineECG Parameter |
Normal |
Outside |
|
QRS |
Percentage (%) of the CineECG which remains within the boundaries of the Normal values between 0.1% and 99.9% in normal distribution |
Percentage (%) of the CineECG which is outside the boundaries of the Normal values (0.1% and 99.9% if normal distribution) |
|
STT |
Idem |
idem |
Secondly, CineECG compares the amplitudes of the recorded ECG also with the bandwidth of amplitudes of the population of normal heart activations. This distribution is based on an analysis of 6400 normal activation patterns.
The analysis output is reflected i in the parameter values in the report:
|
CineECG Parameter |
Normal |
Outside |
|
QRS |
Percentage (%) of the amplitudes which remain within the boundaries of the Normal values between 0.1% and 99.9% in normal distribution |
Percentage (%) of the amplitudes which are outside the boundaries of the Normal values (0.1% and 99.9% in normal distribution) |
|
STT |
Idem |
idem |