One of the key challenges in ECG interpretation is to evaluate recorded ECG data against normal ECG waveforms. The interpretation of the 12-lead ECG is notoriously difficult and requires experts to distinguish normal from abnormal ECG waveforms. ECG waveforms depend on body build and electrode positions, both often different in males and females. And when you take into account the recommended ECG electrode positions are based on males bodies the problems becomes already more visible. As studies indicate on average one or more pre-cordial ECG electrodes (the 6 electrodes closest to the heart) are misplaced in 50% of the ECG recordings with males. But in female ECG recordings the percentage of accurate placed ECG pre-cordial electrodes drops to 20%.
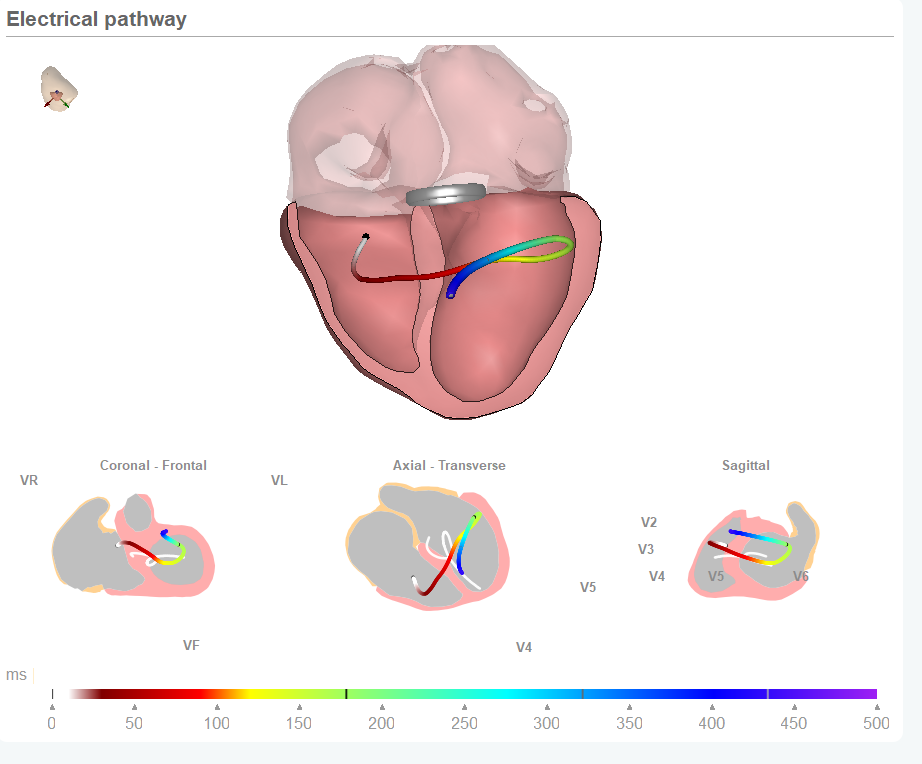
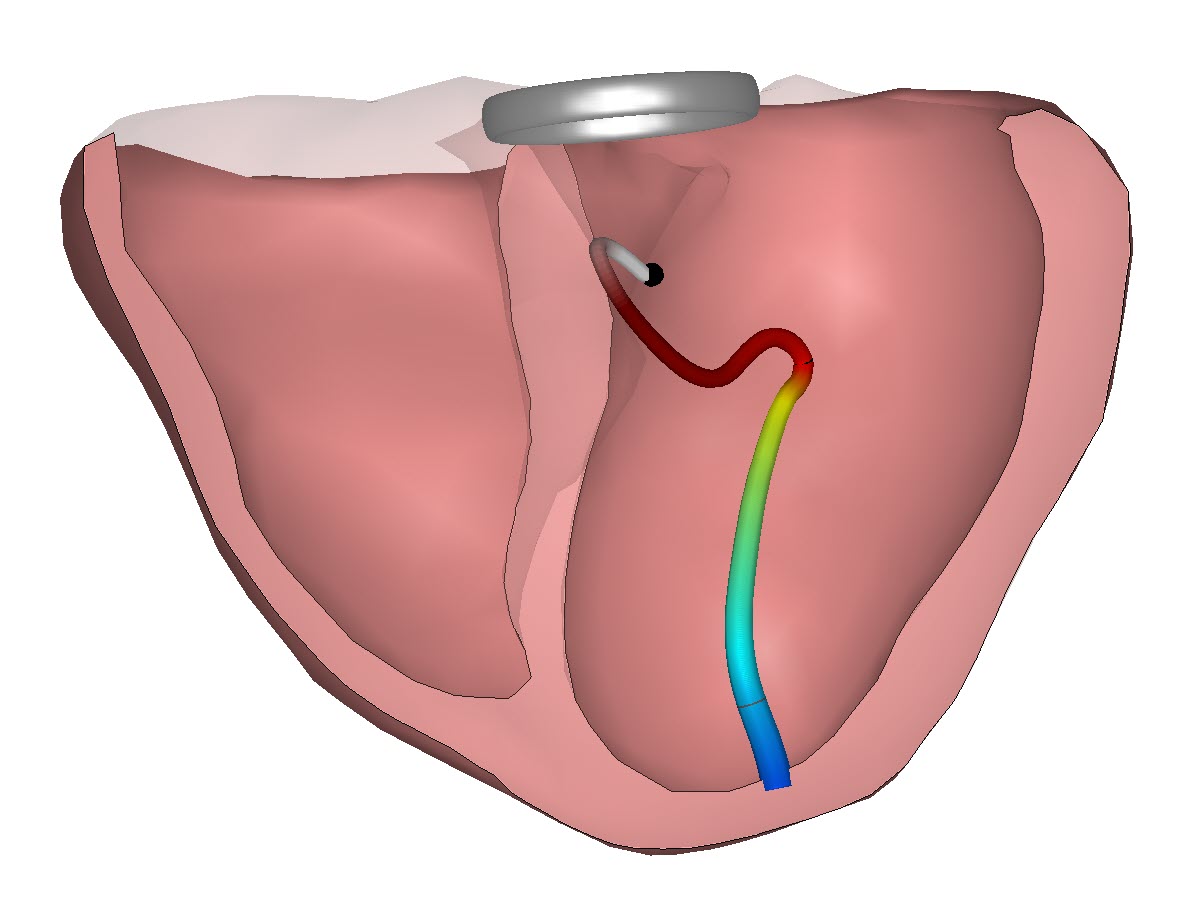
And electrode position changes of 2 cm or more impact the amplitude and shape of the ECG waveforms. And to make ECG waveform interpretation even more complicated the position and rotation of the heart within the body also influences the ECG waveforms.
Normal ECG heart rate and heart rhythm
In the daily clinical practice the ECG waveform interpretation differs from the analysis of heart rate/beat and heart rhythm. This type of analysis does not take the shape and amplitude of the ECG waveform into account. The analysis of heart rate and rhythm look at the duration (in time) of specific parts of the heart activation and recovery cycle. Such a duration period can be a complete cycle and this the base of the heart rate analysis resulting in a beats per minute number.
Or you can look at specific segments and this provides information on for instance the duration of the heart muscle contraction which pumps the blood from the heart into the body. Or the duration of the time interval the activation of the smaller heart chambers endures.
And if you take a bit broader perspective you can look at the consistency of the duration times, again for the whole heart activation and recovery cycle or for specific segments within this cycle.
And if this consistency is missing and we are confronted with significant variabilities in the duration times we consider this irregularities in the heart rhythm.
The analysis of heart rate and heart rhythm analysis is supported by standardization and normalization of the timing of the activation cycle. This means that the measurement grid on which we plot the ECG graphs is standardized. Each cell reflects a specific duration time on the horizontal axis. And this supports the physician in measuring the durations of the segments or the overall heart beat cycle. In the old days this was done by using a calipers.

Today the algorithms are quiet capable of doing the math. This was physicians can distinguish between normal and abnormal heart rate and heart rhythm. But what about normal ECG Waveforms?
Normal ECG waveforms lack standardization
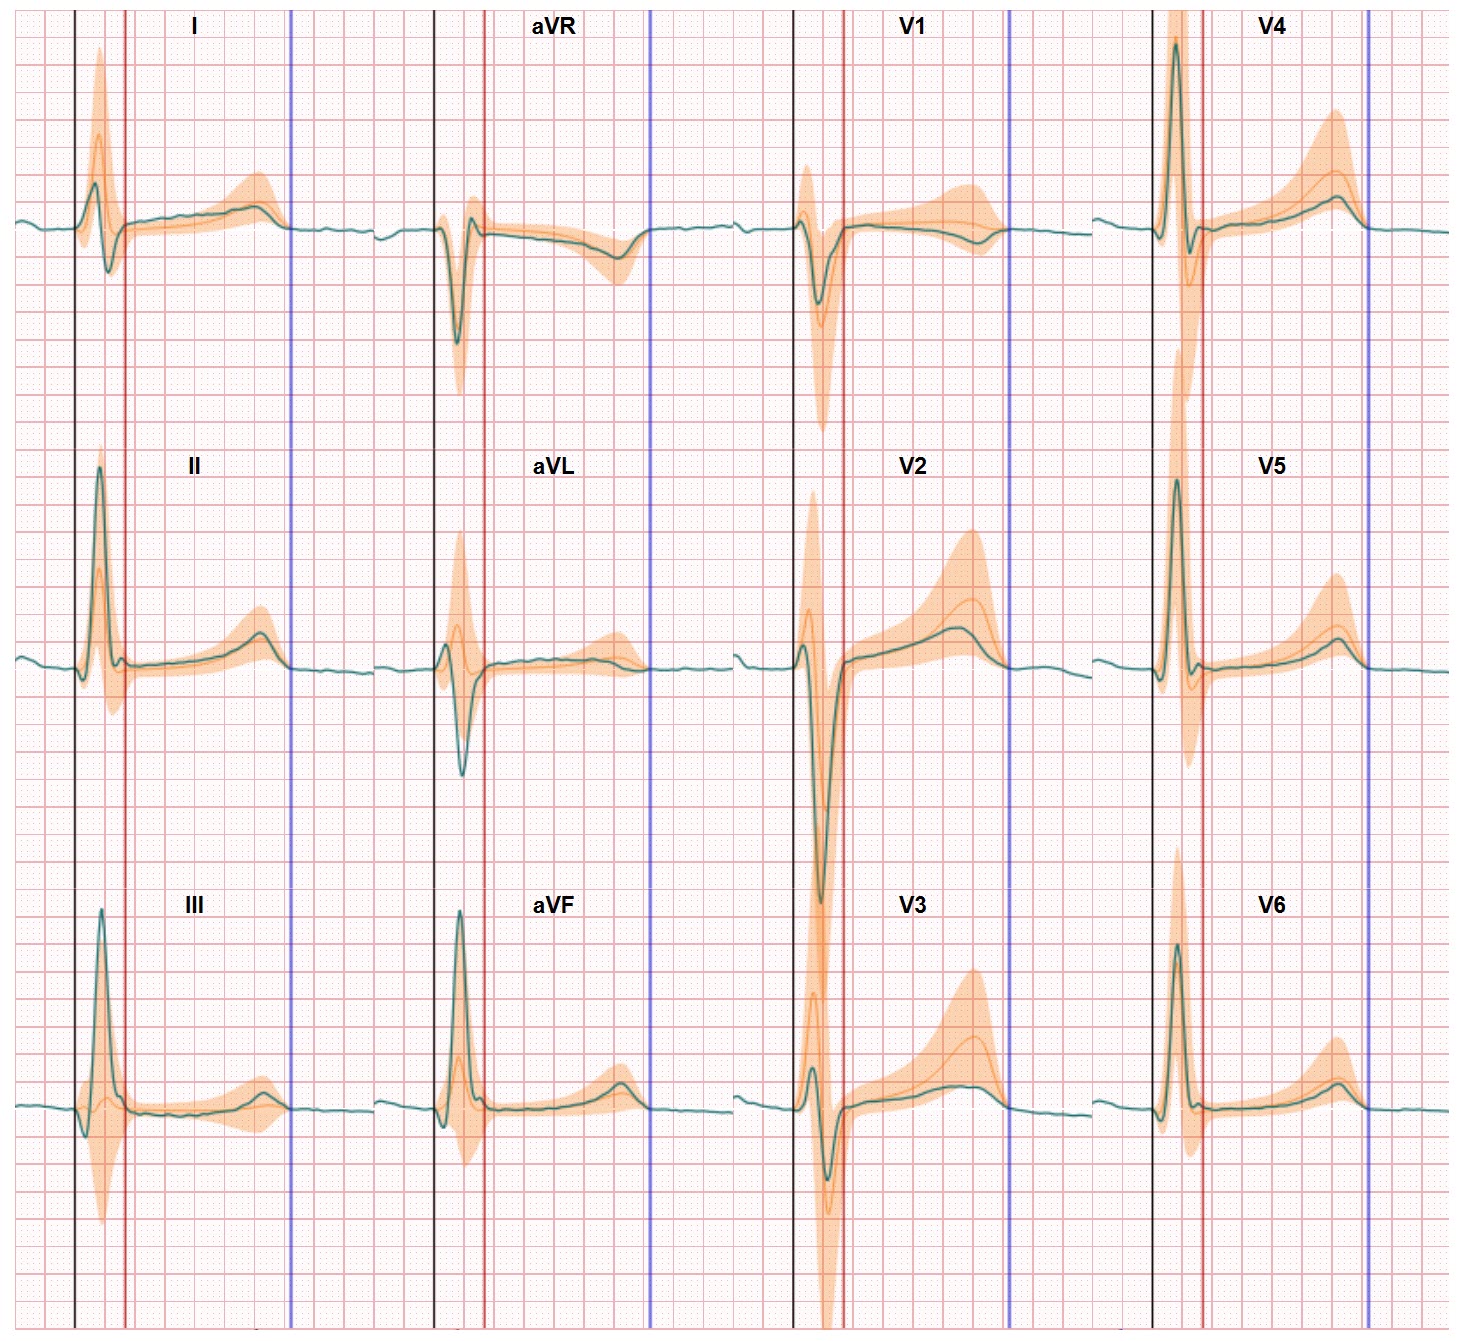
The interpretation of ECG waveforms is really different. Physicians have to evaluate these waveforms and judge if the amplitudes are normal, if the shape is normal and if the value is normal. The value is derived from comparing the waveform with the base line (the horizontal axis) on which the value is zero “0”. In daily live this comparison results in qualitative remarks (compared to the quantitative analysis of the heart rate and heart rhythm) such as ‘elevated ST segment’ or ‘inverted T wave’.
And this assumes the baseline position is known. However if you combine the two variables introduced earlier (ECG electrode positions and Heart orientation/position/rotation) the position of this baseline is not really sure. All these insecurities impact the effective assessment of the ECG waveform. And often result in over-diagnosis (using Ultrasound, CT, MRI, etc.) to evaluate the heart performance. But all these great technologies do not measure the electrical activation, only the mechanical results (muscle contraction, blood flow, tissue thickness, valve performance) of the heart performance. Our team has spent years on addressing the challenge of defining normal ECG waveforms and we have made great progress in bringing the solution to the clinical practice. In a next blog we will dive deeper in the way we have done this. If you can not wait you can always read this article which brings you up to speed with normal ECG waveforms.