In this blog we are proud to present a new dynamic view on the ECG. Over the past years our team has worked on processing the classic 12-lead ECG data and to make 12-lead ECG interpretation easier, better and faster. Since the ECG was introduced more than a century ago physicians are still challenged every day with understanding and interpreting the graphic output of the Electrocardiogram. It’s our team mission to show there’s much more to see in the ECG. And this mission is being accomplished every day. In the past year we have increased the number of partners who have joined us in our research and solution validation.
And so far we have been able to move the analog visualization of the recorded potential differences through the ECG electrodes to a new digital level.
Of course, over the past years the data collected by the ECG recorders has been digitalized but we still use the graphic line presentation of the different electrode combinations in the reporting and report assessment. We have moved away from the calipers and executing the manual heart rate and heart rhythm analysis. Today we are used to rely on the digital markers allocated by the analytical software to calculate the beats per minute and the interval times in the ECG graph. And we accept some differences in the calculation of these interval times since they can differ with the algorithms used by the different brands of ECG recorders.
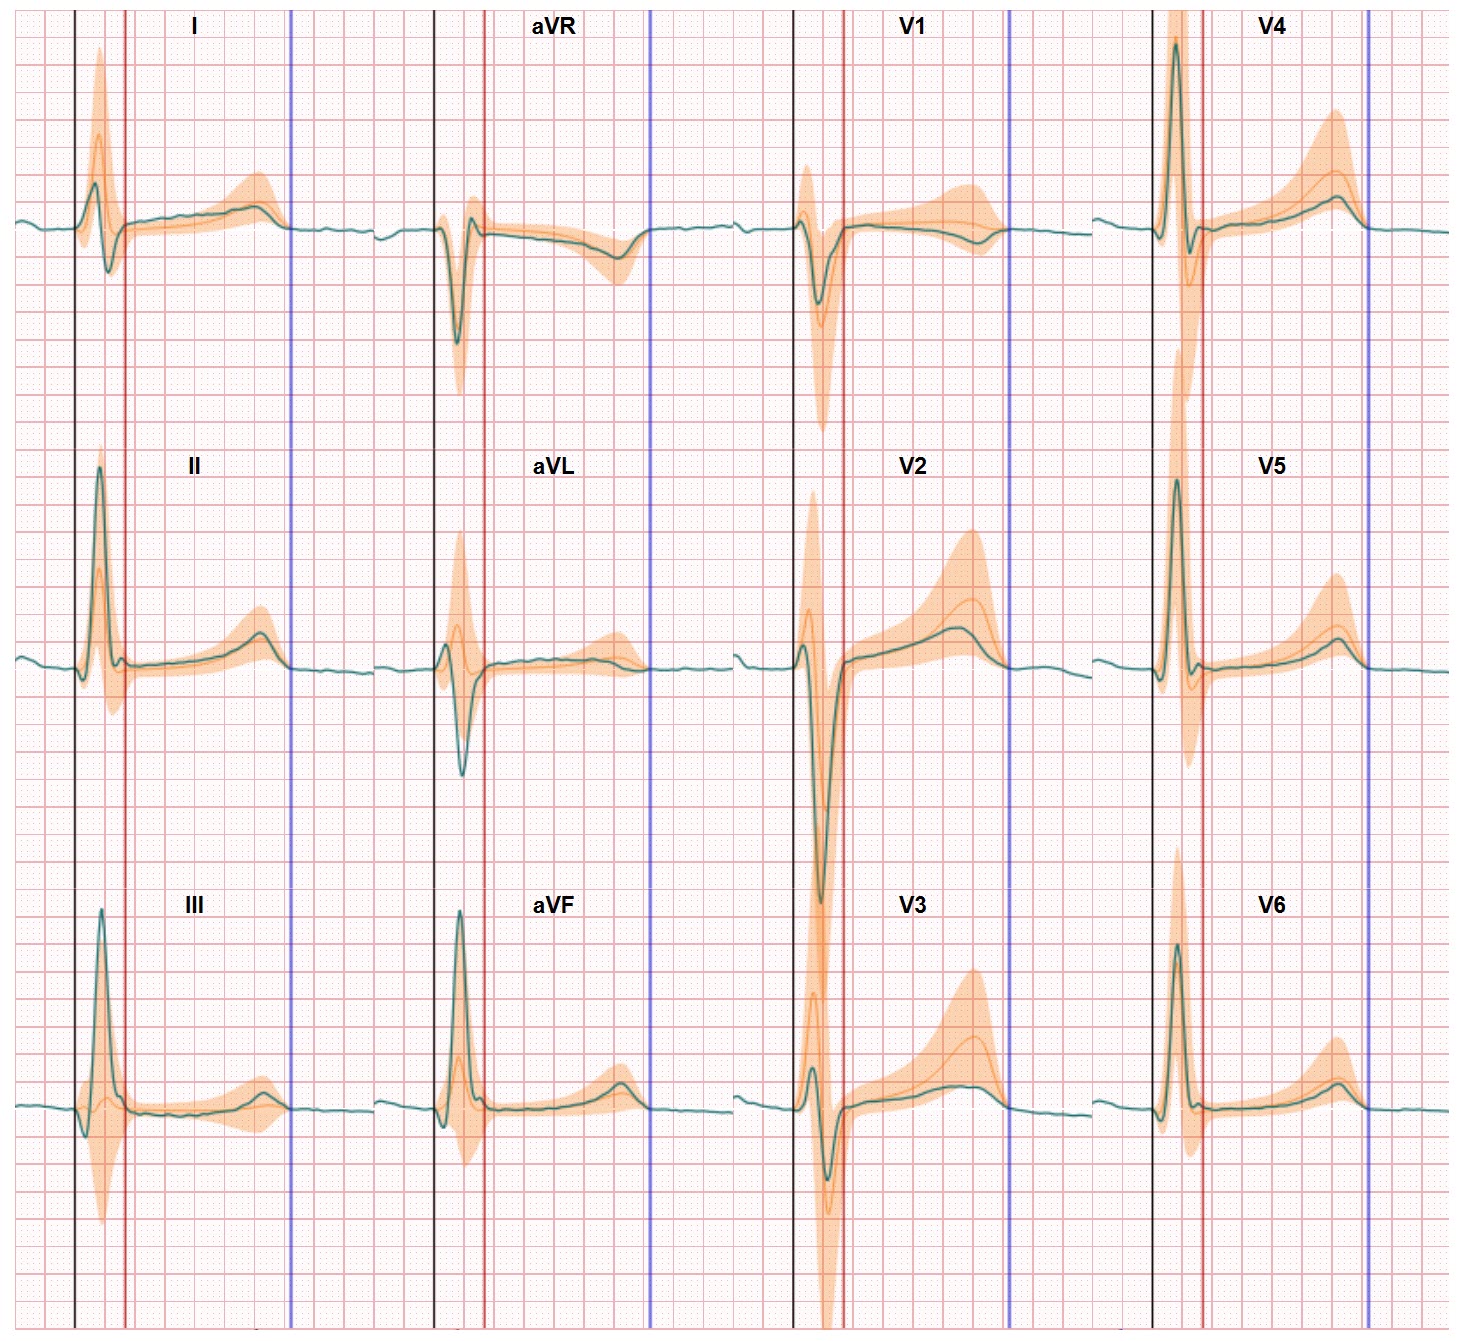
But we are also still faced with a marginal performance by these algorithms regarding the ECG waveform analysis, the part of the ECG graph in which the calipers don’t help you. We still accept qualitative assessments (elevated ST, depressed ST, inverted T wave, etc.) for the ECG assessment which could tell us about the heart tissue performance in terms of conduction or other performance parameters regarding the flow of the current through the heart tissue.
Our team has successfully managed to develop new views on this part of the heart performance and this way our technologies support easier and better ECG waveform interpretation.
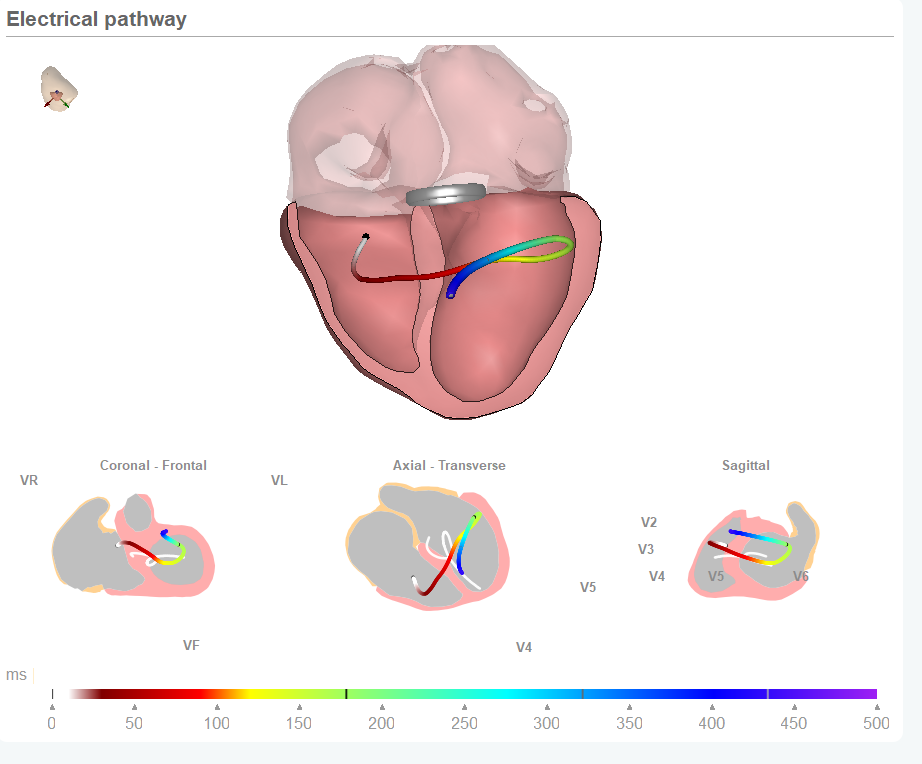
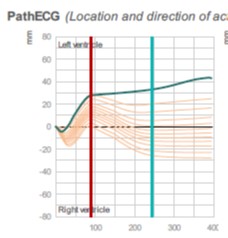
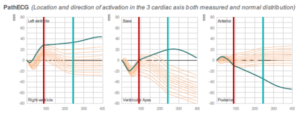
By applying inverse cardiac modelling we relate the ECG data to the heart anatomy and this enables us to show the electrical pathway of the heart activation and repolarization through the heart. And compare a persons electrical pathway with a normal distribution of healthy persons ECGs.
This way our technology supports physicians in the ECG assessment process and reduces the need for additional diagnostic technologies.
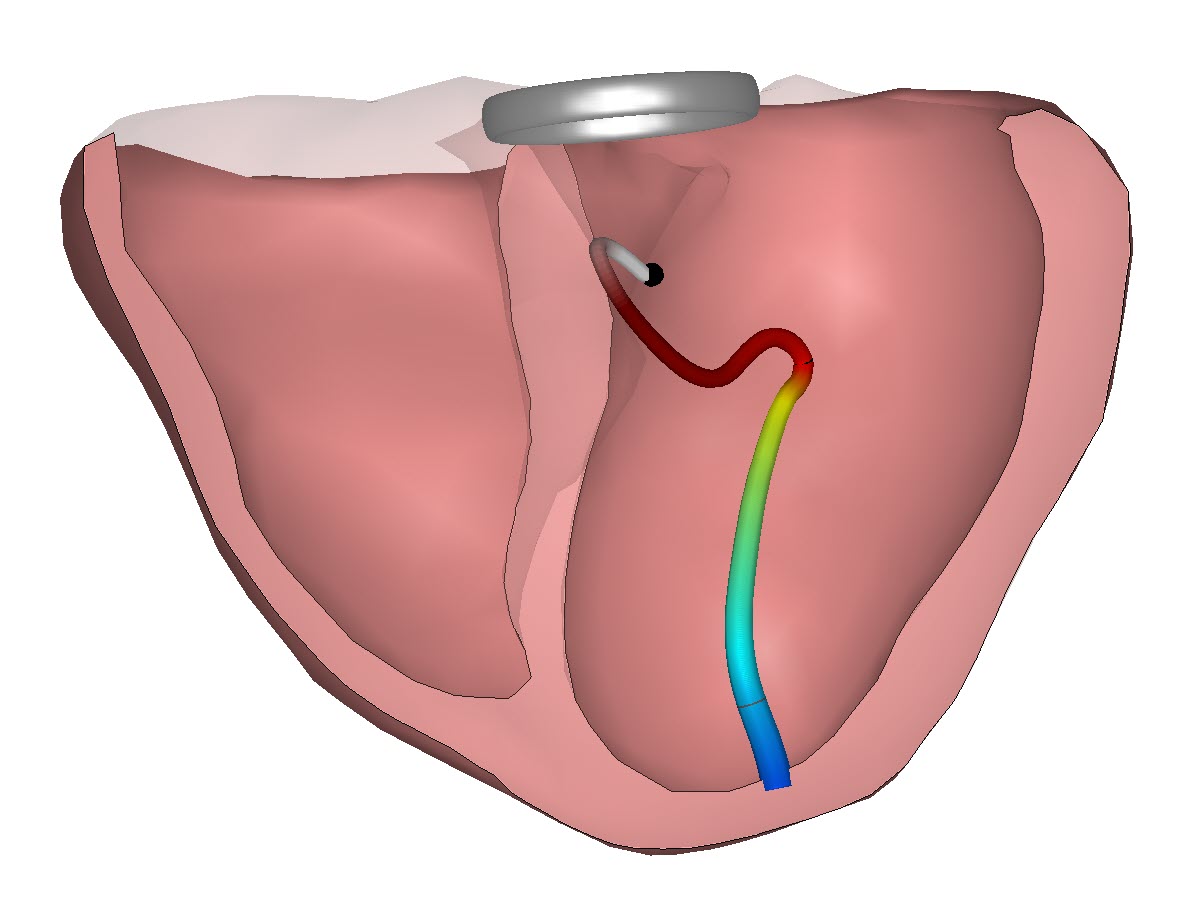
And just now we have started to move this technology even further. We have started to introduce a time-laps approach towards a continuous rest ECG recording. And this opens new options for real time conduction assessments of the heart. In the example we see the changing of the conduction pattern during an intervention (blowing up a balloon inside a heart) which results in an infarct.
As a team we are thrilled with this new simple option to support physicians. We know there’s still lots of work to do but the clinical options are numerous. There’s really more to see in the ECG. And if you want to learn more there are other video’s on CineECG to see.