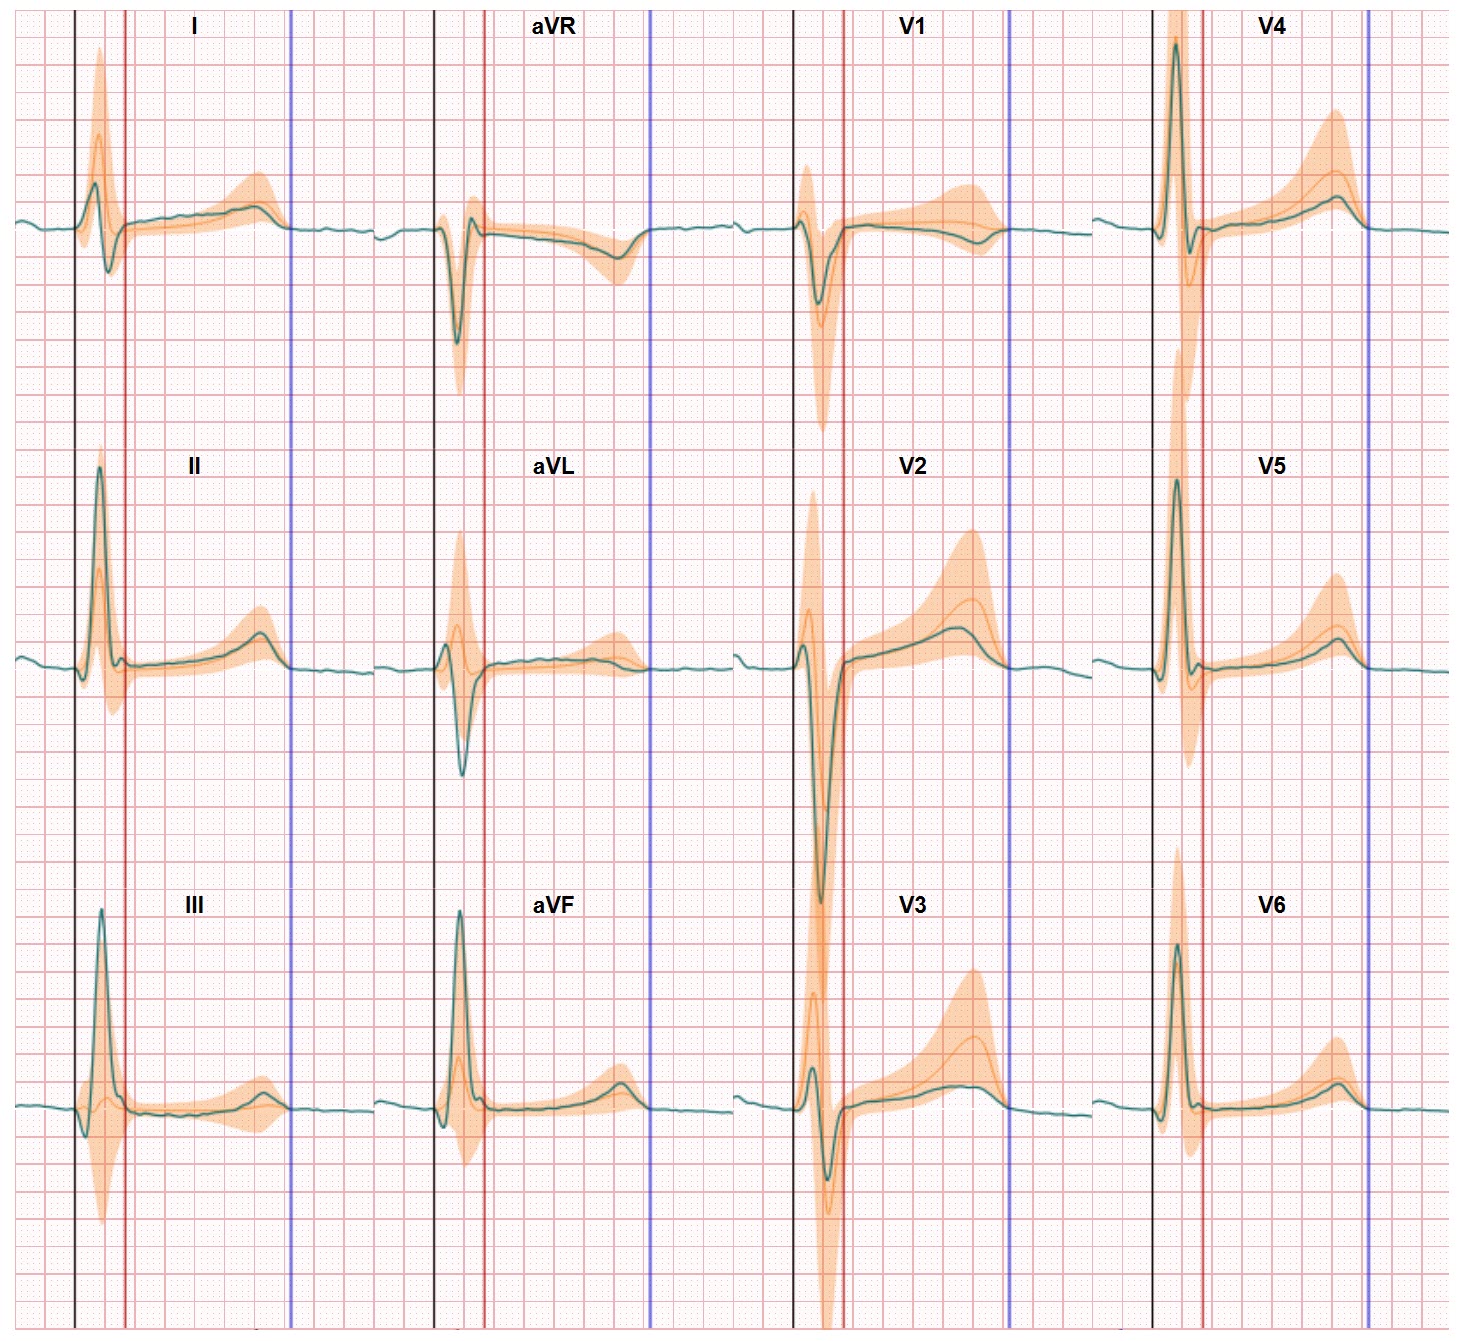
What are the electrocardiogram basics? An electrocardiogram (ECG) is one of the simplest, non-invasive and fastest tests used to evaluate the heart. The ECG was first brought to market in 1911 by the Dutch professor Willem Einthoven. And Einthoven based his innovation on the conceptual work of other scientists such as Waller. To record an ECG a person will get 10 Electrodes placed at certain spots on the chest, arms, and legs. These electrodes are often in the shape of a disposable plastic/metal patch. The ECG electrodes are connected to an ECG machine by lead wires. The electrical activity of the heart is then measured and shown to a physician in the form of graphs. These graphs represent the recorded electrical potential differences measured between two electrodes. In the case of a so-called 12-lead ECG the physician will use 10 electrodes and the data is presented in 12 different graphs. Each showing a different segment of the heart. The ECG only records, there’s no electricity sent into the body.
Most ECG devices produce the graphs either on printed paper or on a monitor or computer display/screen. Also most ECG devices have embedded analytical software which runs a first diagnostic analysis of the recorded data.
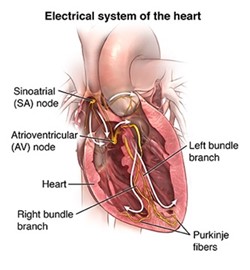
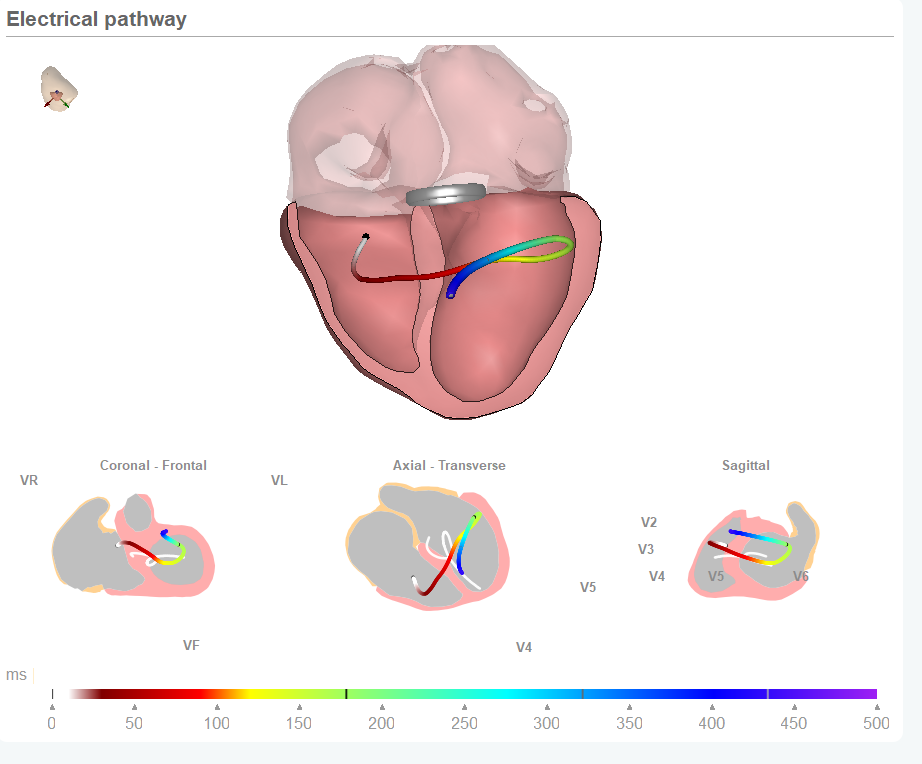
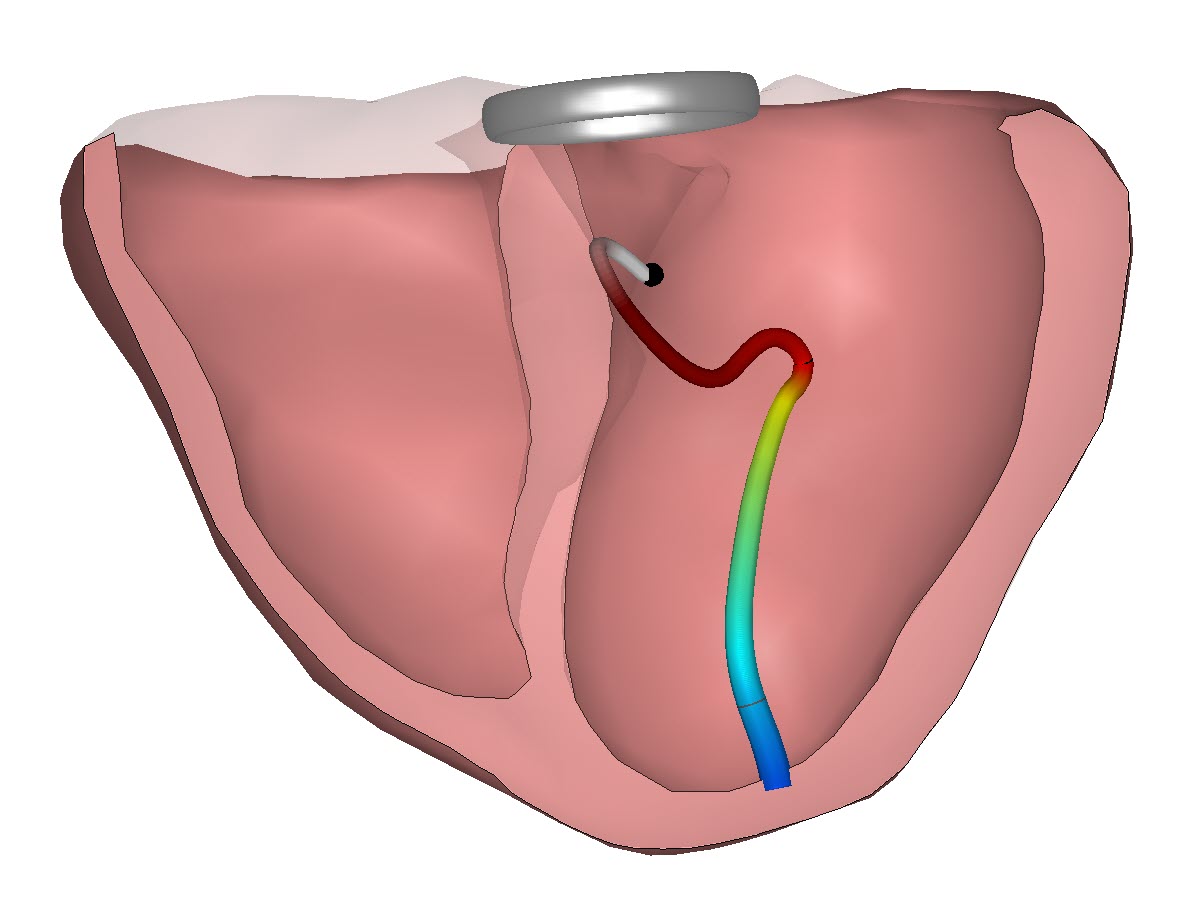
The ECG registers the electrical activation of the heart. Within the heart an electrical pulse is generated and this impulses ‘travel’ through the heart to activate the heart muscles. And these muscle contractions take care of the opening and closing of the valves and the pump mechanism which ensures the blood is flowing through a persons body. An ECG records these impulses to show how fast the heart is beating (heart rate), show the rhythm of the heart beats (steady or irregular), and the strength and timing of the electrical impulses as they move through the different parts of the heart. This way the ECG shows information on the conduction performance of the heart tissue. Changes in an ECG (changes in time between specific moments in the activation cycle or changes in the shape and values of the ECG waveforms) can be a sign of many heart-related conditions.
An electrocardiogram (ECG) is a quick, easy way to assess the heart’s function. Risks associated with ECG are minimal and rare.
When do you need an ECG?
Some reasons for your doctor to request an electrocardiogram (ECG) include:
- When you experience chest pain
- When you experience symptoms ( tiredness, shortness of breath, dizziness, irregularities in your heart beat which may be related to heart performance
- To help determine the overall health of the heart before procedures such as surgery; or after treatment for conditions such as a heart attack (myocardial infarction, or MI), endocarditis (inflammation or infection of one or more of the heart valves); or after heart surgery or cardiac catheterization
- To see how an implanted pacemaker is working
- To determine how well certain heart medicines are working
There may be other reasons for your doctor to recommend an ECG.
How accurate is an ECG?
Determining the performance of your heart in terms of heart rate and heart rhythm is a proven and reliable process. The timing of these parameters can be compared to a set of normal healthy values in most cases. Although detection of certain heart rhythm issues is already more complicated. Simple heart rate registration can already been executed by using 2 electrodes placed anywhere on the torso. More indepth heart rhythm analysis can be supported by more electrodes but again the position of the electrodes is less relevant.
However, the analysis of the conduction performance (how the electrical impulses travel through the heart tissue) is based on an evaluation of the ECG waveforms and this is far more complicated. And the use of the 12-lead ECG system (with 10 electrodes placed on specific locations) is needed. A specific complication in ‘reading’ ECG waveforms is the impact on the shape of the waveforms due to variations in the heart position within the body and the positions of the electrodes. The ECG is an indirect measurement and the electrodes for conduction analysis operate like small camera’s. Combining two uncertainties (how is the heart positioned? And are the electrodes placed correct?) results in uncertainty on the quality of the ECG graph. First, the baseline level is not ensured and this makes it difficult to ‘see’ if a waveform has a positive and negative value. And these values indicate the direction the electrical impulse in the heart. Second, the shape of the ECG waveform may be different because the ‘angle’ of the electrode camera is different when it is placed on a slightly different position.
Today 12-lead ECG waveforms are often (46% according to a publication in Jama Internal Medicine in 2020) not correct interpreted. And given the high volume of 12 lead ECGs recorded this results in an estimate of plus 1 million 12-lead ECGs each day which are not correct interpreted.
This may be an explanation for the high level of supportive diagnostic instruments used in the detection of heart diseases. Such as Ultrasound (Echocardiography), CT or MRI scans, and Xray images. But be aware all these other solutions do not record the electrical activation of the heart but only register mechanical parameters.
Improving Electrocardiogram basics
To end with a more positive message, progress is now made to boost the accuracy of the ECG waveform interpretation. New digital technologies are added to the Electrocardiogram basics and these technologies support physicians in early and better identification of normal and abnormal heart performances.