In ECG interpretation identifying abnormalities is the focus and the ECG amplitude is one of the focal points but in this blog we raise the question do ECG waveforms tell more than amplitudes?
For the past hundred years the quantitative part of ECG interpretation was mostly about measuring the heart rate and heart rhythm and measuring the amplitude heights/lows of specific segments of the ECG (P-wave, QRS complex, ST segment, T wave, etc.)
But the ECG amplitudes are only a small portion of the ECG waveform segment characteristics and these waveforms provide much more information regarding the conduction and activation & recovery performance of the heart. The amplitudes show the (milli)voltage registered by the electrodes on the skin combined with an indication of the direction of the current through the heart (plus or minus value).
ECG waveforms and this includes the amplitudes are influenced by a range of parameters such as age, sex, race, body build, heart rate, the ECG electrode positions and the heart orientation (the heart ‘floats’ in the torso and differs per person in its position measured in 3 axis).
Taking these aspects into account make it hard to determine a ‘normal’ value (as the reference for an abnormal pattern) and therefore makes it a challenge to deliver a correct interpretation. ECG recorders often embed software and algorithms to deliver an indicative analysis but within these software programs the software is programmed to select the so-called fiducial points within the ECG. Fiducial points are the onset, peak, and offset of the P-wave, QRS complex, and T- wave. The detection and allocation of a correct fiducial point is the basis for automated ECG signal analysis and there’s no standard available. But the impact of a different fiducial point selection is high with regard to the analysis of wave segments duration and peak value determination. Which adds another hurdle to correct ECG interpretation. What remains is a qualitative assessment of the waveform segments: e.g. elevated ST, depressed ST, inverted T-wave. But this only works in significant deviations of these segments against the baseline in the ECG graph since the position of this baseline is also variable and influenced by the factors mentioned earlier.
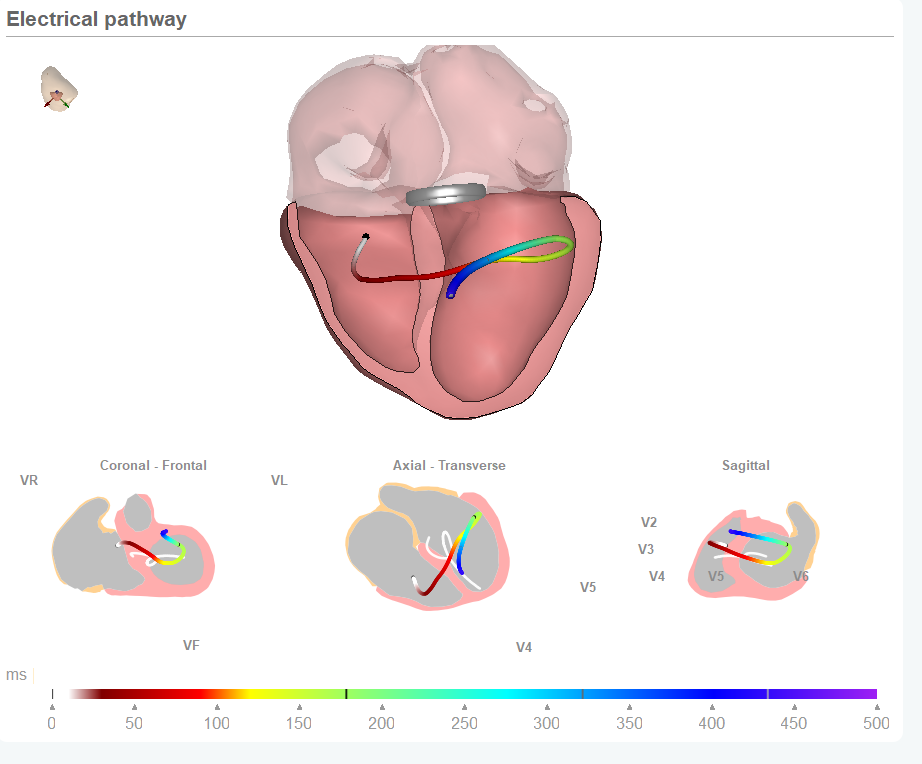
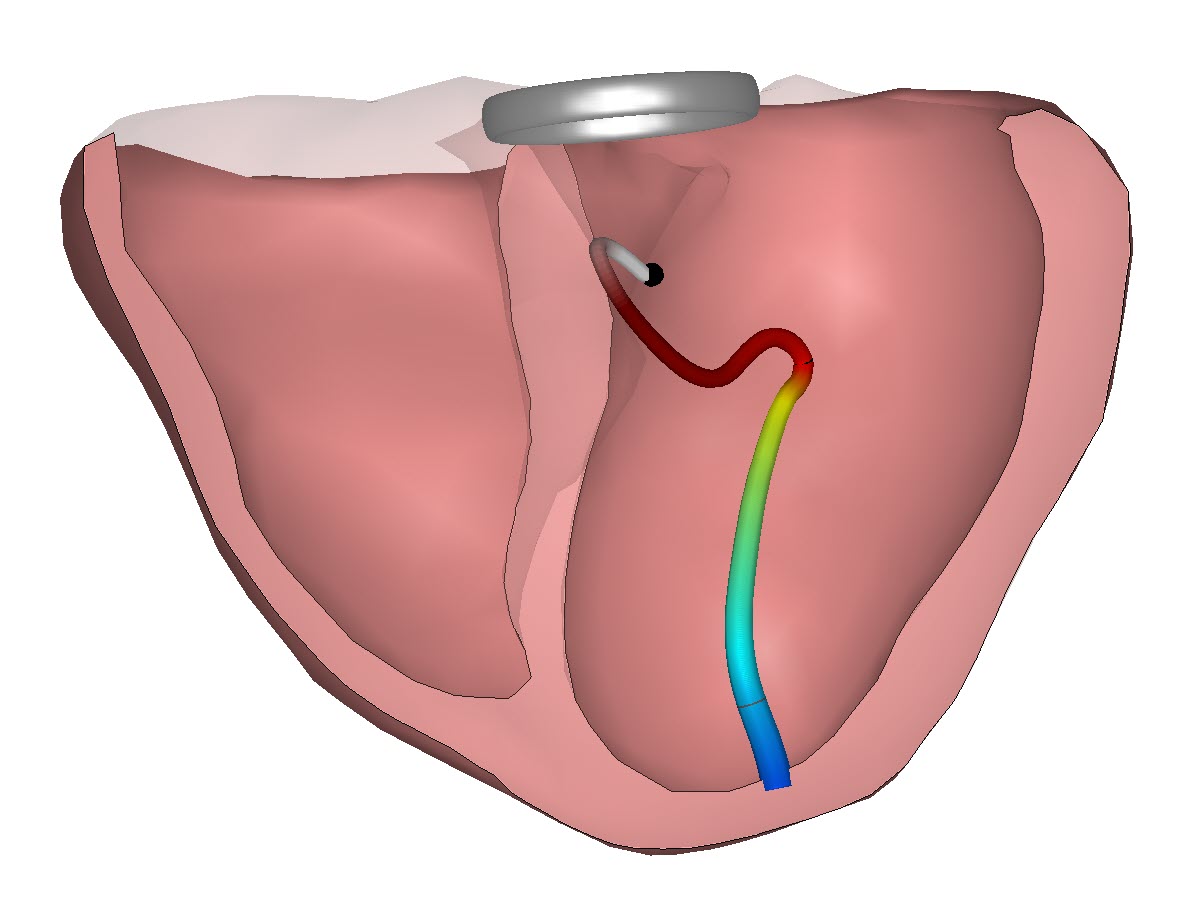
CineECG shows ECG waveforms tell more than amplitudes
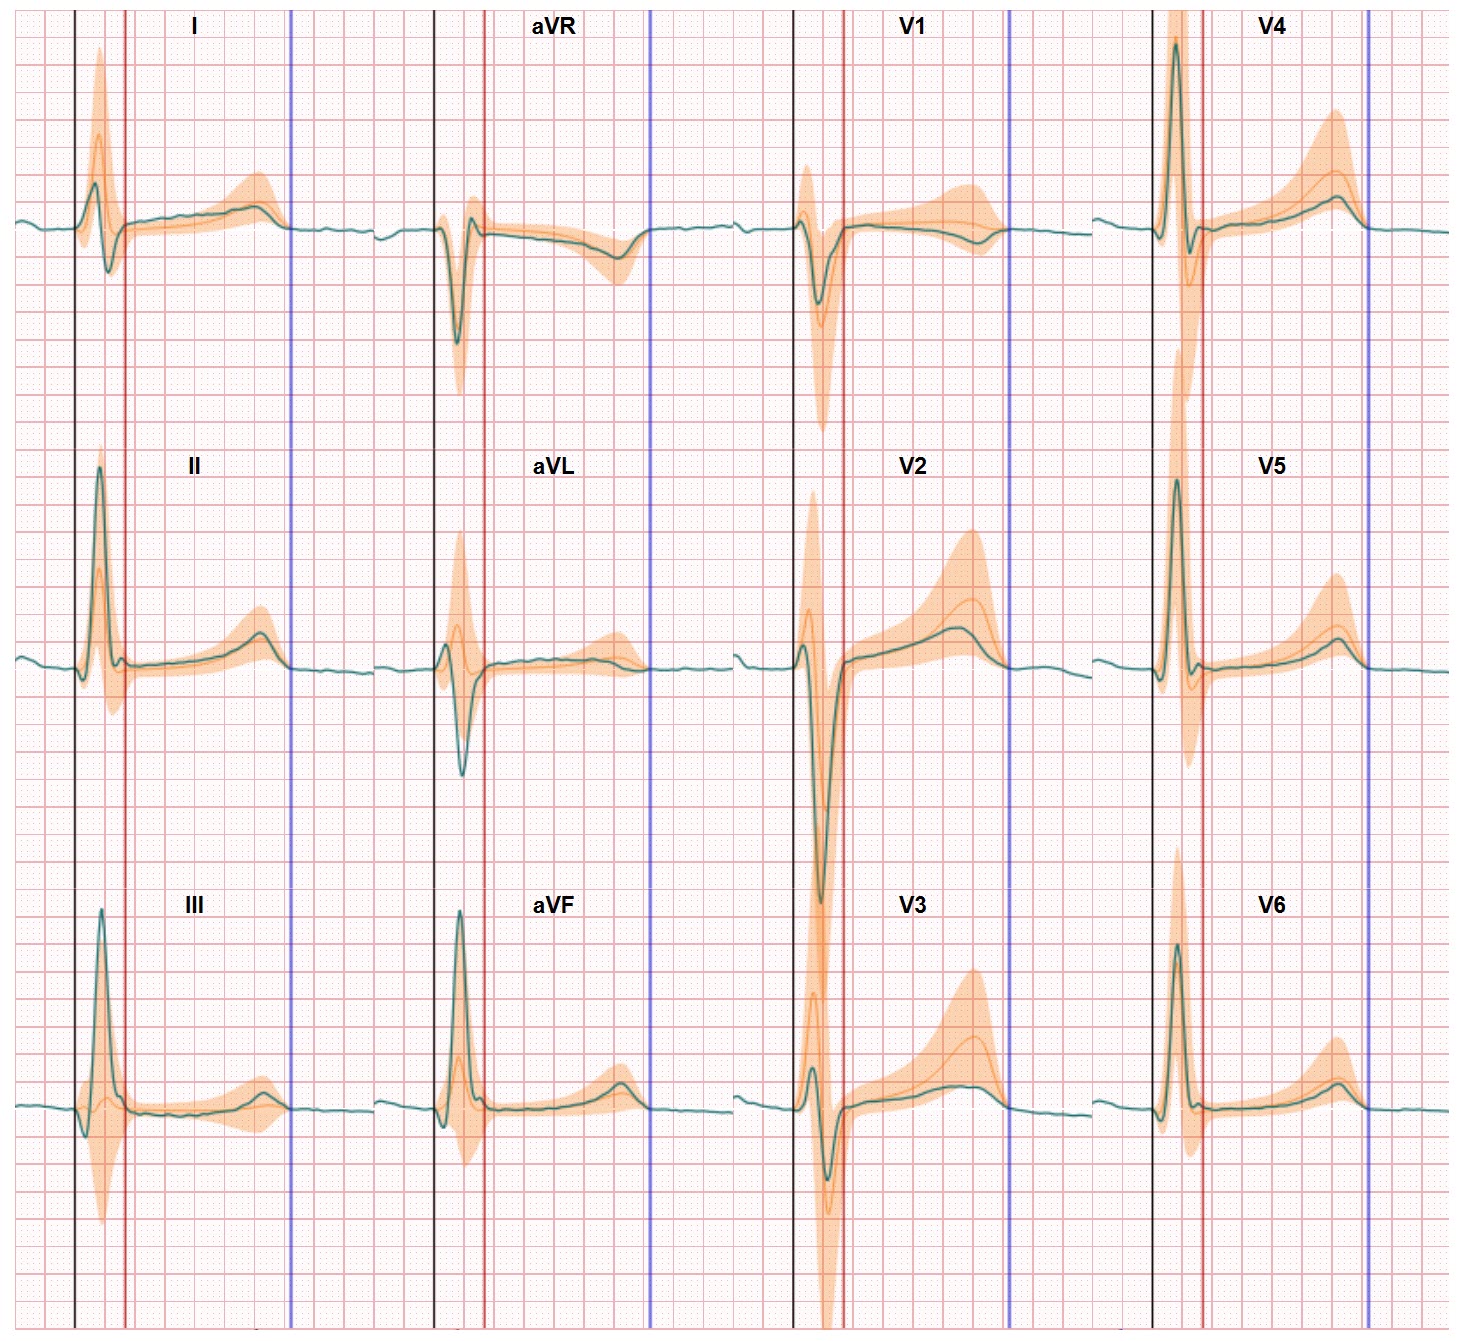
With our novel CineECG technology we are addressing these ECG limitations in ECG waveform interpretation. In this quantitative approach our software the whole waveform is taking into consideration when comparing the recorded value with a ‘normal’ waveform. This way we eliminate the issue of fiducial allocations variability and first ‘standardize’ the ECG waveform before we make the analysis.
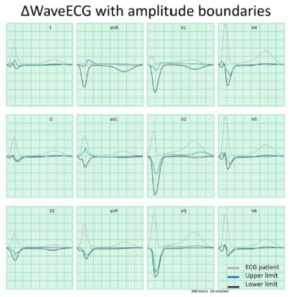
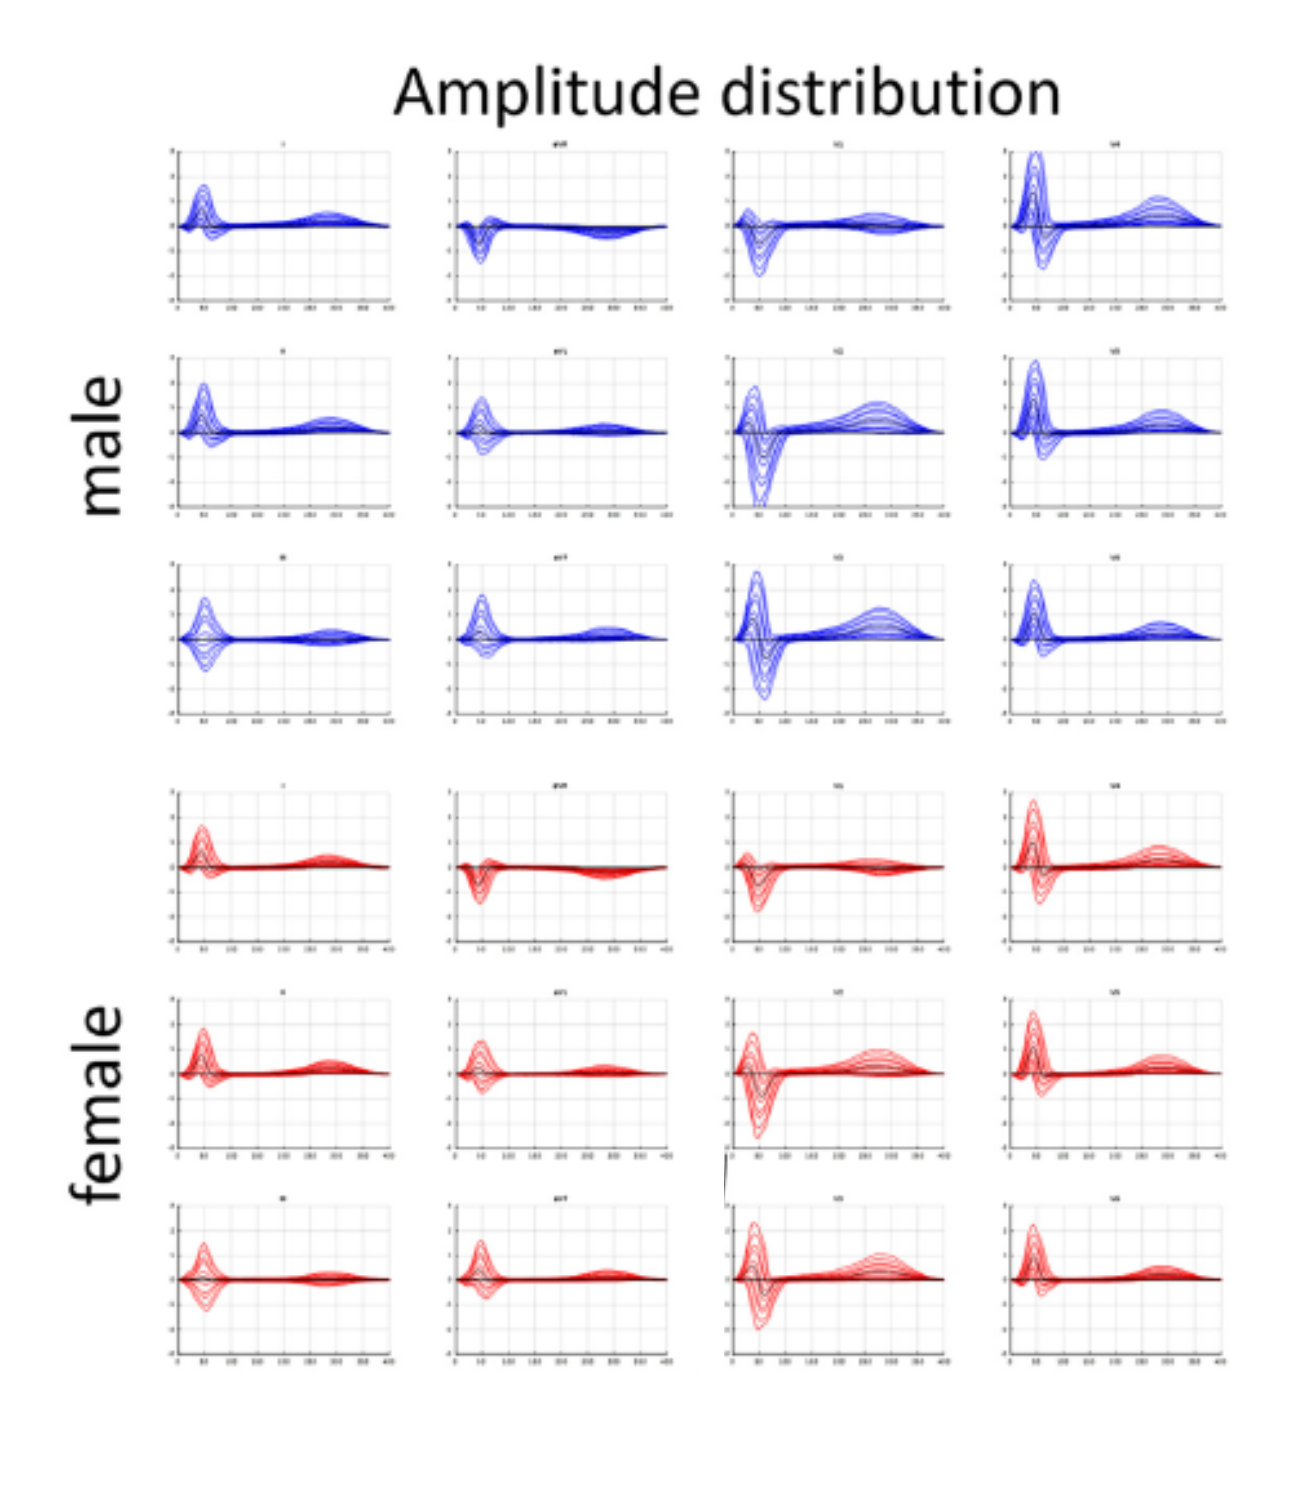
When the whole waveform is analysed and compared with a normal distribution of classified normal ECG’s it become easier to distinguish normal from abnormal ECG’s. Furthermore it is easier to use difference between male and female waveform amplitudes since this difference is statistical significant but very hard to spot when you make a visual assessment of an ECG graph. More information on this approach was published last year in the Journal of Electrocardiology in an study from Proniewska. The article states: The ΔWaveECG (part of CIneECG) proofs to be an simple and powerful method to identify ECGs with abnormal amplitudes in different segments of the ECG, e.g., the QRS, ST segment, and the remainder of the STT segment. This quantitative and objective method might be helpful in the accurate selection of cardiac patients early in the clinical workflow, for instance already at the general practitioners level or at the emergency department.
We look forward to coming pilots in which we will further demonstrate and validate the added value of CineECG. And we look forward to further differentiate the segmentation of ‘normal’ values since this approach makes it simple to enter differences not only between gender but also age, disease history, geographical background etc.