The Electrocardiogram today is mainly used in a static type of analysis, but what about using ECG based tracking of conduction changes? A bit of background first. The ECG was invented over a 100 years ago and is today the most used early phase diagnostic tool when medical professionals are looking for an assessment of the electrical heart performance. After all these years the ECG base technology is still used. Electrodes placed on the skin register potential differences resulting the electrical activation and recovery processes in the heart.
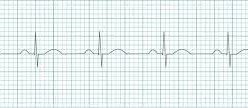
And these electrical signals are visualized in graphic lines which represent the recorded voltages between two electrodes during a cycle set against time. This way the physician can evaluate the timing of an heart activation cycle, evaluate the timing of a specific phase of the activation cycle, evaluate the consistency of the timing of activation cycles / phase (spot irregularities). And the physician can evaluate the height and width of the ECG waveforms.
Heart rate and heart rhythm analysis is rather straightforward
For the evaluation of heart rate and heart rhythm just 2 electrodes are sufficient and the rhythm strip which is the result of the recorded is used to measure the duration of activation cycles / phases and the consistency (or irregularities) of the timing. Practically this means only the horizontal Axis is used for this analysis.
By adding more electrodes the quality of the assessment can be improved and the heart rate/rhythm can be determined from different angles of the heart. But again only the horizontal Axis data is used.
Continuous ECG monitoring is applied to investigate if suspected arrhythmia’s occur during a certain period (couple of hours of days) but not so frequent that these irregularities are registered within the 10 or 30 seconds of a standard resting ECG in which the patient lies on a bench.
So-called stress-ECG’s are used to investigate how heart rate and rhythms change due to physical activity or after an intense physical activity.
Heart conduction analysis is next level
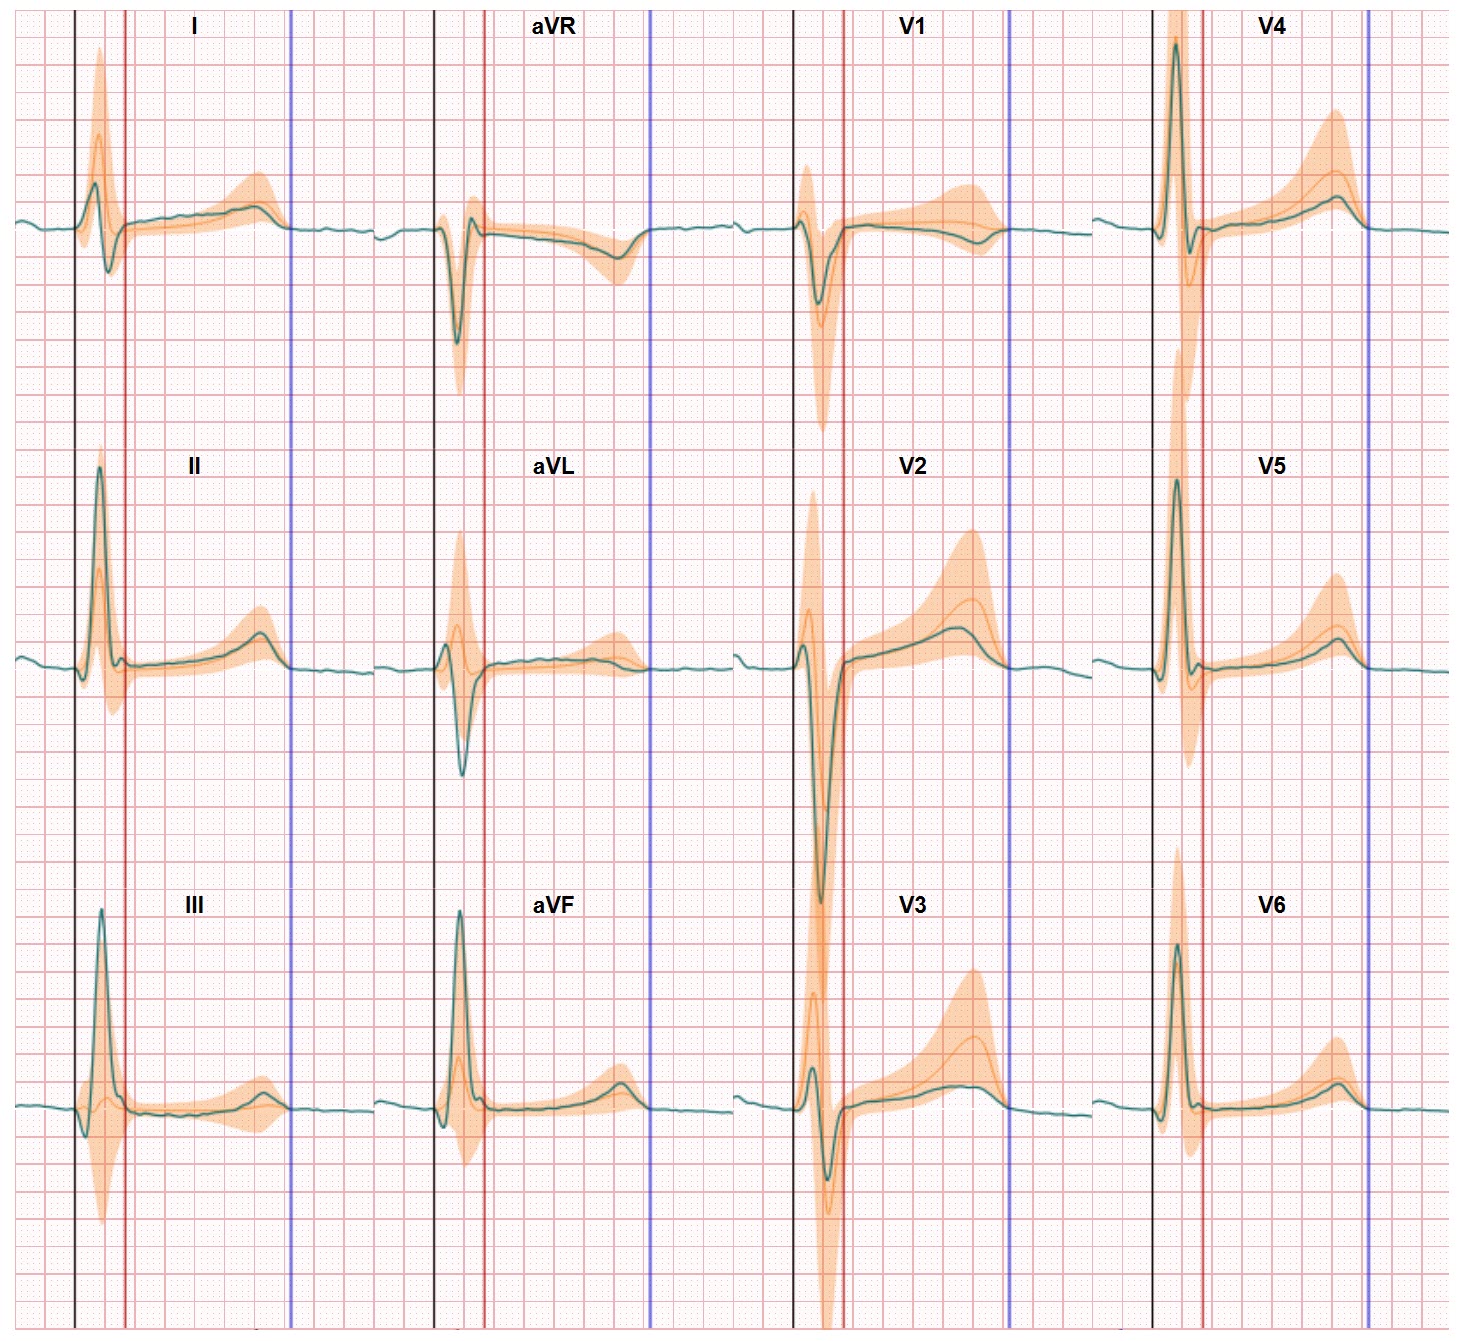
For an effective assessment of the heart conduction performance using 10 electrodes is recommended and these electrodes need to be placed at specific locations on the body. This requisite is absent for heart rate and rhythm ECG recordings. A standard 12 lead ECG (12 views/graphs are derived from the 10 electrodes) records about 10 seconds of a number of heart activation cycles.
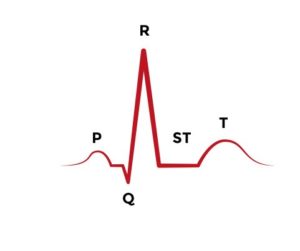
The shape (height, width, slope) and value (against the baseline in the graph) of the ECG waveforms is the base of the heart conduction assessment. Different from the quantitative heart rate and heart rhythm analysis this type of ECG analysis still has a qualitative base. Specific parts of the ECG graph are normal, elevated, depressed, inverted etc. A major hurdle is the impact the position of the heart within the torso and the positions of the electrodes on the torso have on the ECG waveforms. Unlike the use of continuous ECG recording for heart rate and heart rhythm analysis this approach in heart conduction analysis is more or less missing from the heart monitoring portfolio of technologies. Determining the progress in conduction disorders or evaluating the effectiveness of an cardiac intervention (medication or surgery) is executed by comparing ECG waveforms of patient over time (e.g. every year or before and after the intervention) but the effectiveness of this approach is hindered again by the impact of electrode positions which make the origin of small ECG waveform changes open to multiple interpretations. There’s no use of real time on line ECG based conduction.
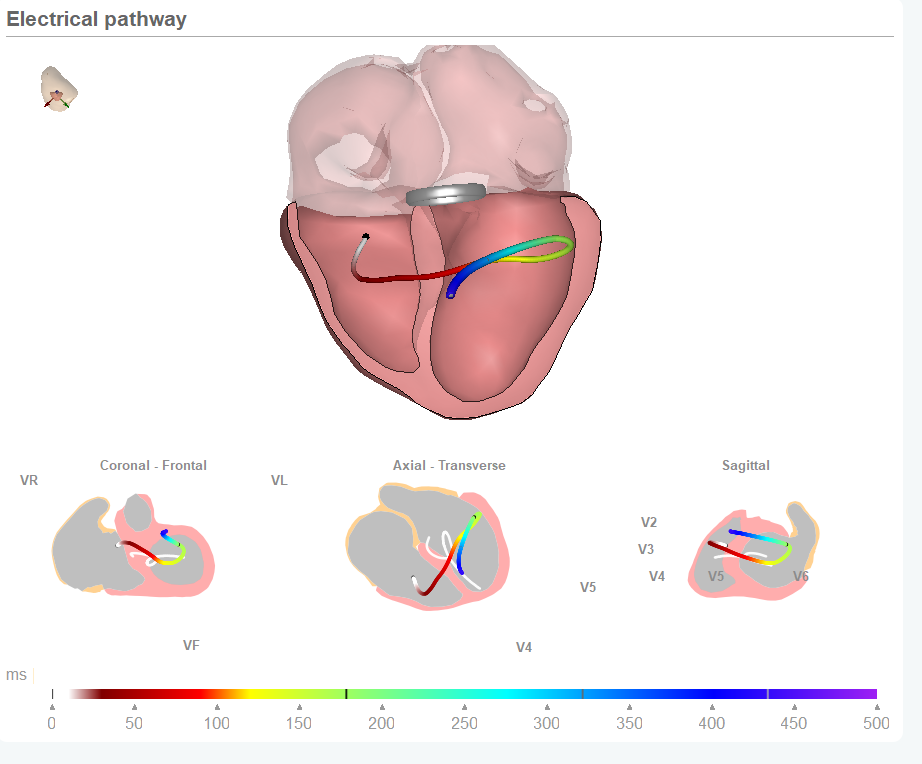
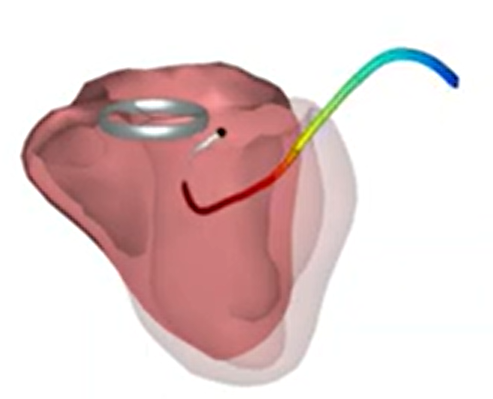
CineECG makes the ECG based tracking of conduction changes possible
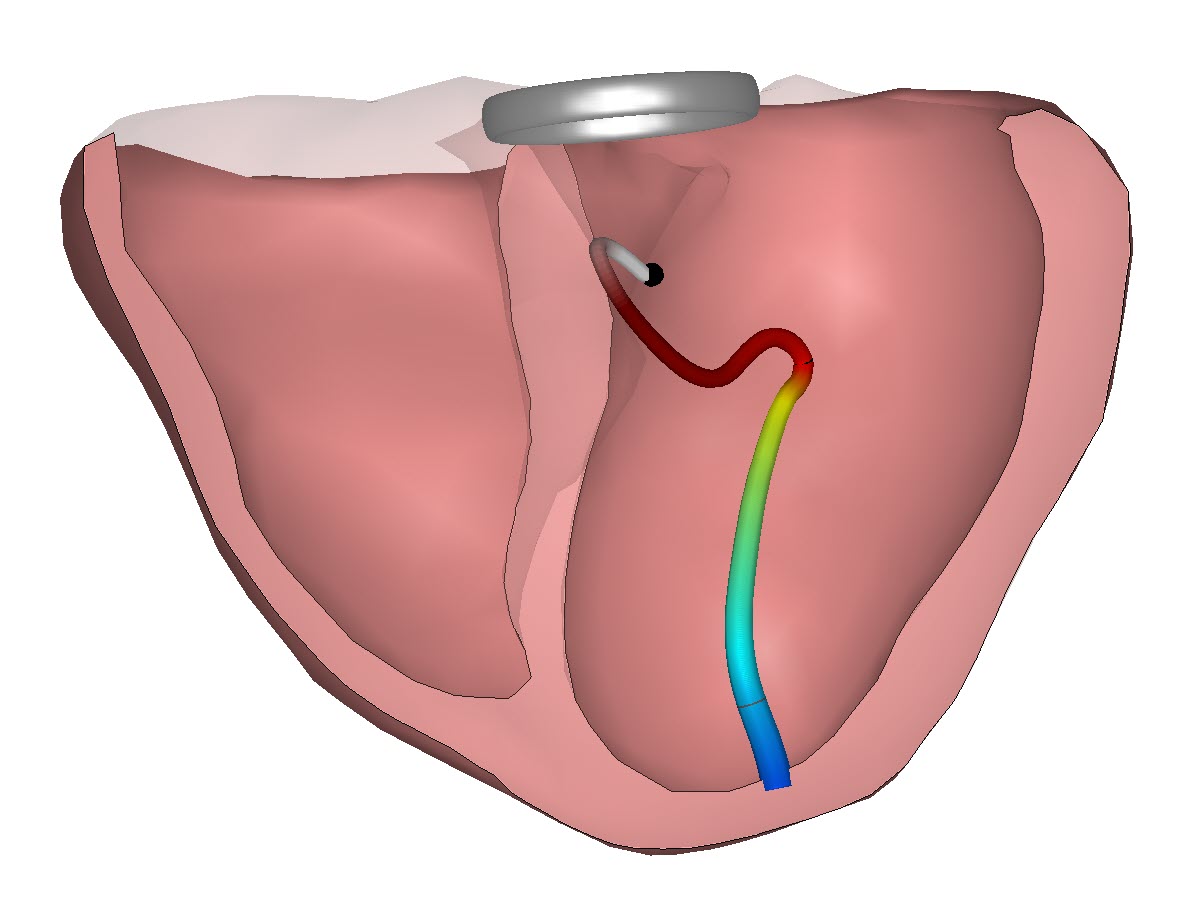
With our new CIneECG technology it is possible to visualize the activation process in the heart and to move beyond the difficult to interpret line graphs.
By relating the ECG data to the heart anatomy we offer a new view and showcase how the recorded conduction compares to a normal healthy conduction activation. And this opens the option for entering a dynamic presentation of conduction changes. By applying a combination of CineECG and high frequency analysis of 10 second recording sessions it’s possible to see for instance the impact of a cardiac intervention regarding the heart conduction. In the video this is demonstrated for a situation in which a balloon was inflated to free up a vein and in the process created an ischemic situation.