In a recent Mayo Clinic’s ECG podcast in their Making Waves series the focus was on Computerized ECG interpretation. The main guest is this podcast was Ian Rowlandson, a pioneer in the field of computerized electrocardiography for more than 35 years. Today mr. Rowlandson works for GE Healthcare and he is currently leading the Clinical Strategy and Diagnostic Electrocardiology team.
In this interview the early phases of computerized electrocardiography are memorized. In the 1950s the amplifier technology lead to improvements in the resolution and quality of the recorded ECG signals. After which the first conversion from analog to digital data happened at the end of that decade. This digitization was executed at large computers and not on the ECG recording device and the data processing took quit some time. It also meant the digitized data was not immediately available for the cardiologist. In the 1980s the technology finally enable data transportation over telephone lines which made it possible to connect the ECG recording device with the main computer. And 10 years later the ECG recording devices were able to run simple programs themselves. Which brought computerized ECG interpretation at the hands of the doctor.
And this is were it still is. The current ECG recorders just run the analysis using software and determining parameters which have not changed for the past 30 years in their basic setup.
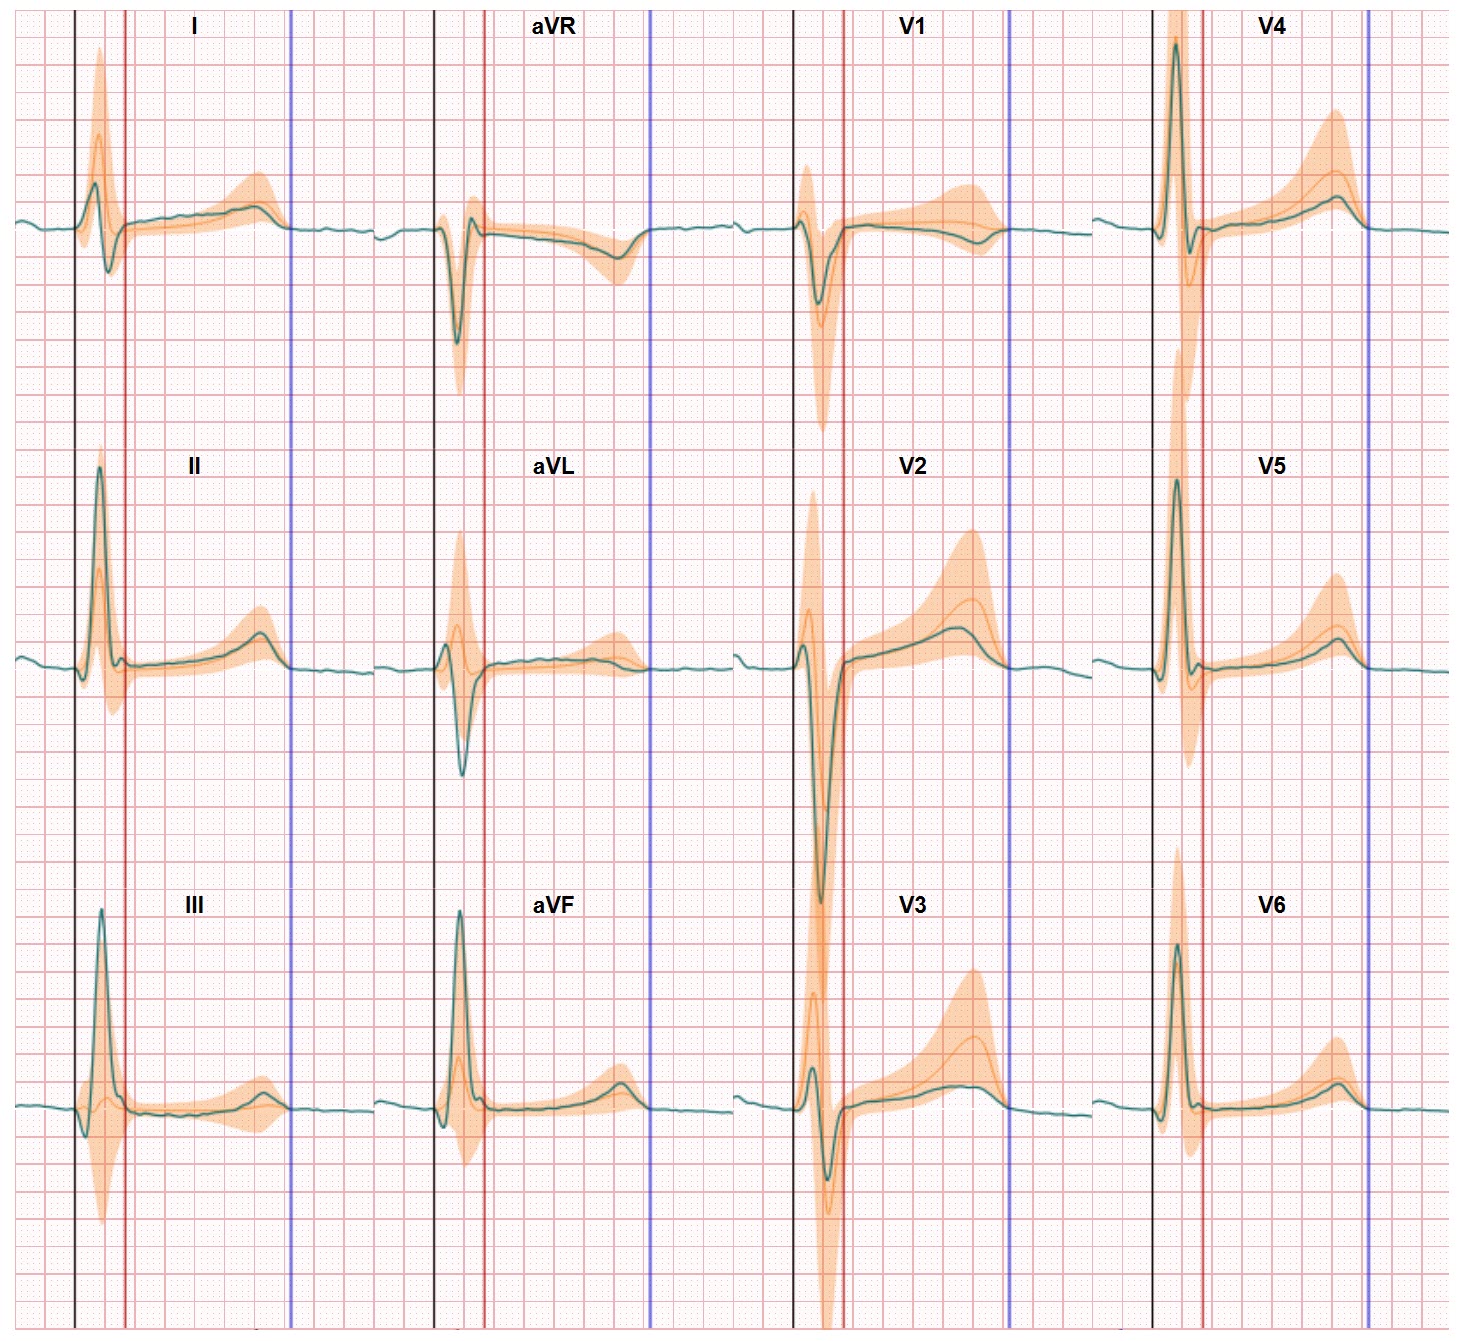
In the interview Ian Rowlandson elaborates on the vast amounts of ECG data which are now available for improving the analysis which is based on the criteria formulated many years ago. AI is mentioned as an option to further improve but the fact remains the base principles of computerized ECG interpretation are actually still based and copying the human interpretation of the traditional ECG graphs. Indeed, as Rowlandson mentions the digital data from a 10 second rest ECG contains much more detail than the printed version on the 2 dimensional graphs presented to the physicians. The rhythm strip for instance only shows 4.5 seconds of the recording. And all the subtleties in the data are not visible in the printed graphs.
Moving to the next level with computerized ECG interpretation
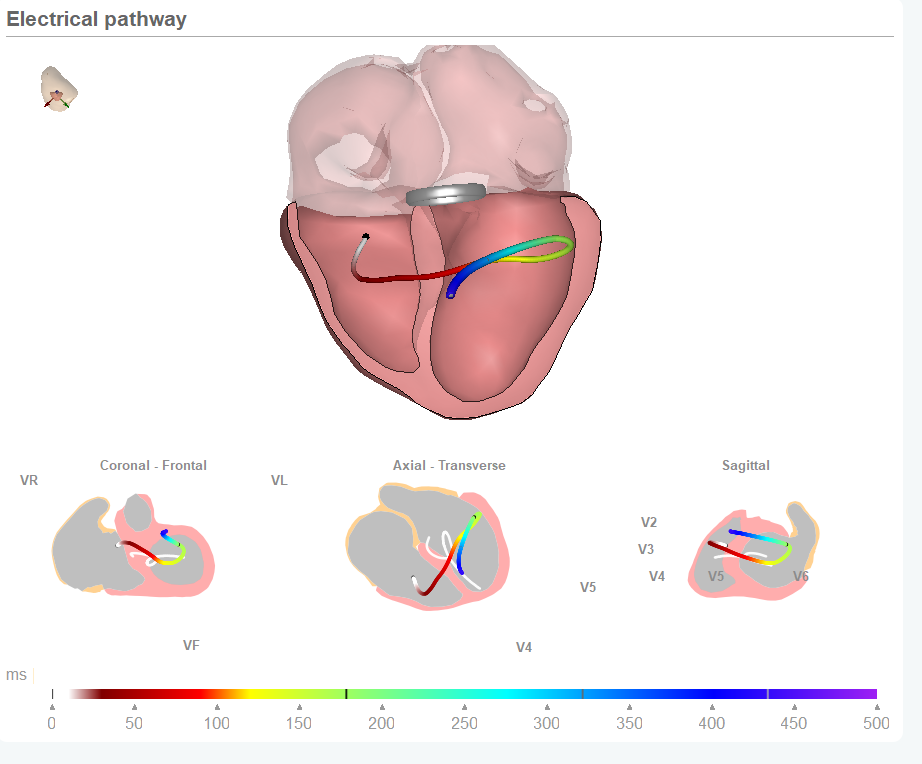
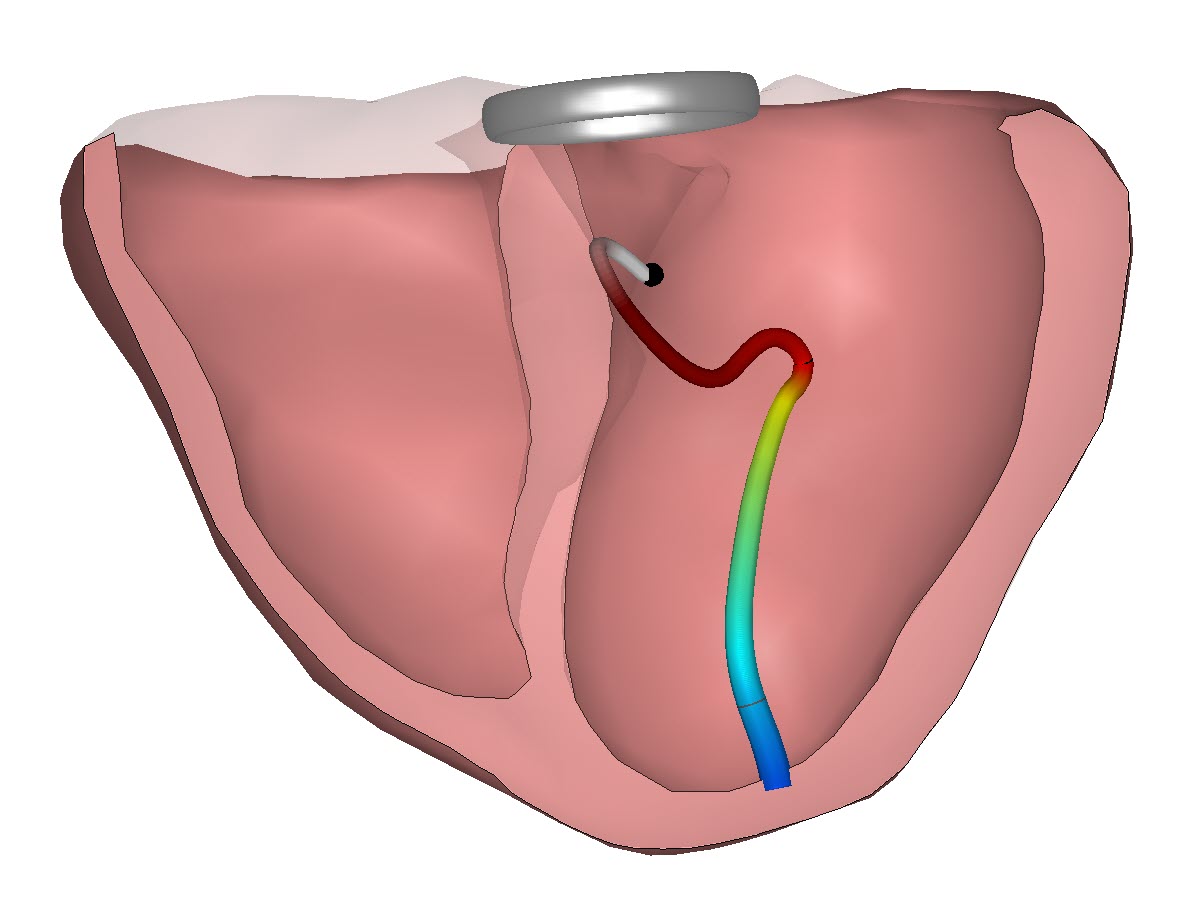
From ECG Excellence performance there’s much more to see in the ECG as Rowlandson correctly mentions. But we think we can go beyond the current approach towards computerized ECG interpretation. In our vision this can be achieved by relating the ECG data to the heart anatomy and support the ECG interpretation by showing more information regarding position and direction of the average electrical current during the activation cycle. This is not adding new data since the data is already captured in the ECG recording. But this way we can bypass the ECG interpretation hurdles which have transferred from the analog version to the digitized versions which are still the base of computerized ECG interpretation. With this new approach we want to revitalize the ECG and ensure its clinical power of this wonderful low cost, rapid and painless diagnostic tool will further increase.