How to read and interpret an ECG is a century old challenge
When professor Willem Einthoven invented and launched the first Electrocardiograph machine in 1911 he probably did not envisage the massive use of the ECG analysis.
If he was still alive today he also probably would be amazed on the enormous volume of books, lectures, courses, tutorials, websites dedicated to the art of 12 lead ECG interpretation. Just searching for ECG interpretation on Amazon.com results in 300 available books. And Dr. Smith’s ECG Blog draws thousands of visitors every week.
The quest for accurate ECG interpretation is still on going
If you look up the history of the ECG technology one can wonder why the last major technology change mentioned in Wikipedia is dated back to 1942. And even then this change was the extension of the number of ECG electrodes which are placed on the torso, hence the birth of the 12 lead ECG. Over the years the ECG analysis for heart rhythm and arrythmia detection has improved significantly. In this process you have to calculate the time between certain moments in the ECG graph (which reflects the recorded potential differences on the skin) to determine for instance the number of ‘beats per minute’ or the duration of heart activation phases. Traditionally this was done by using a caliper and today the algorithms (for instance in the ECG device, your Apple Watch or the AliveCor application on your mobile) do the job

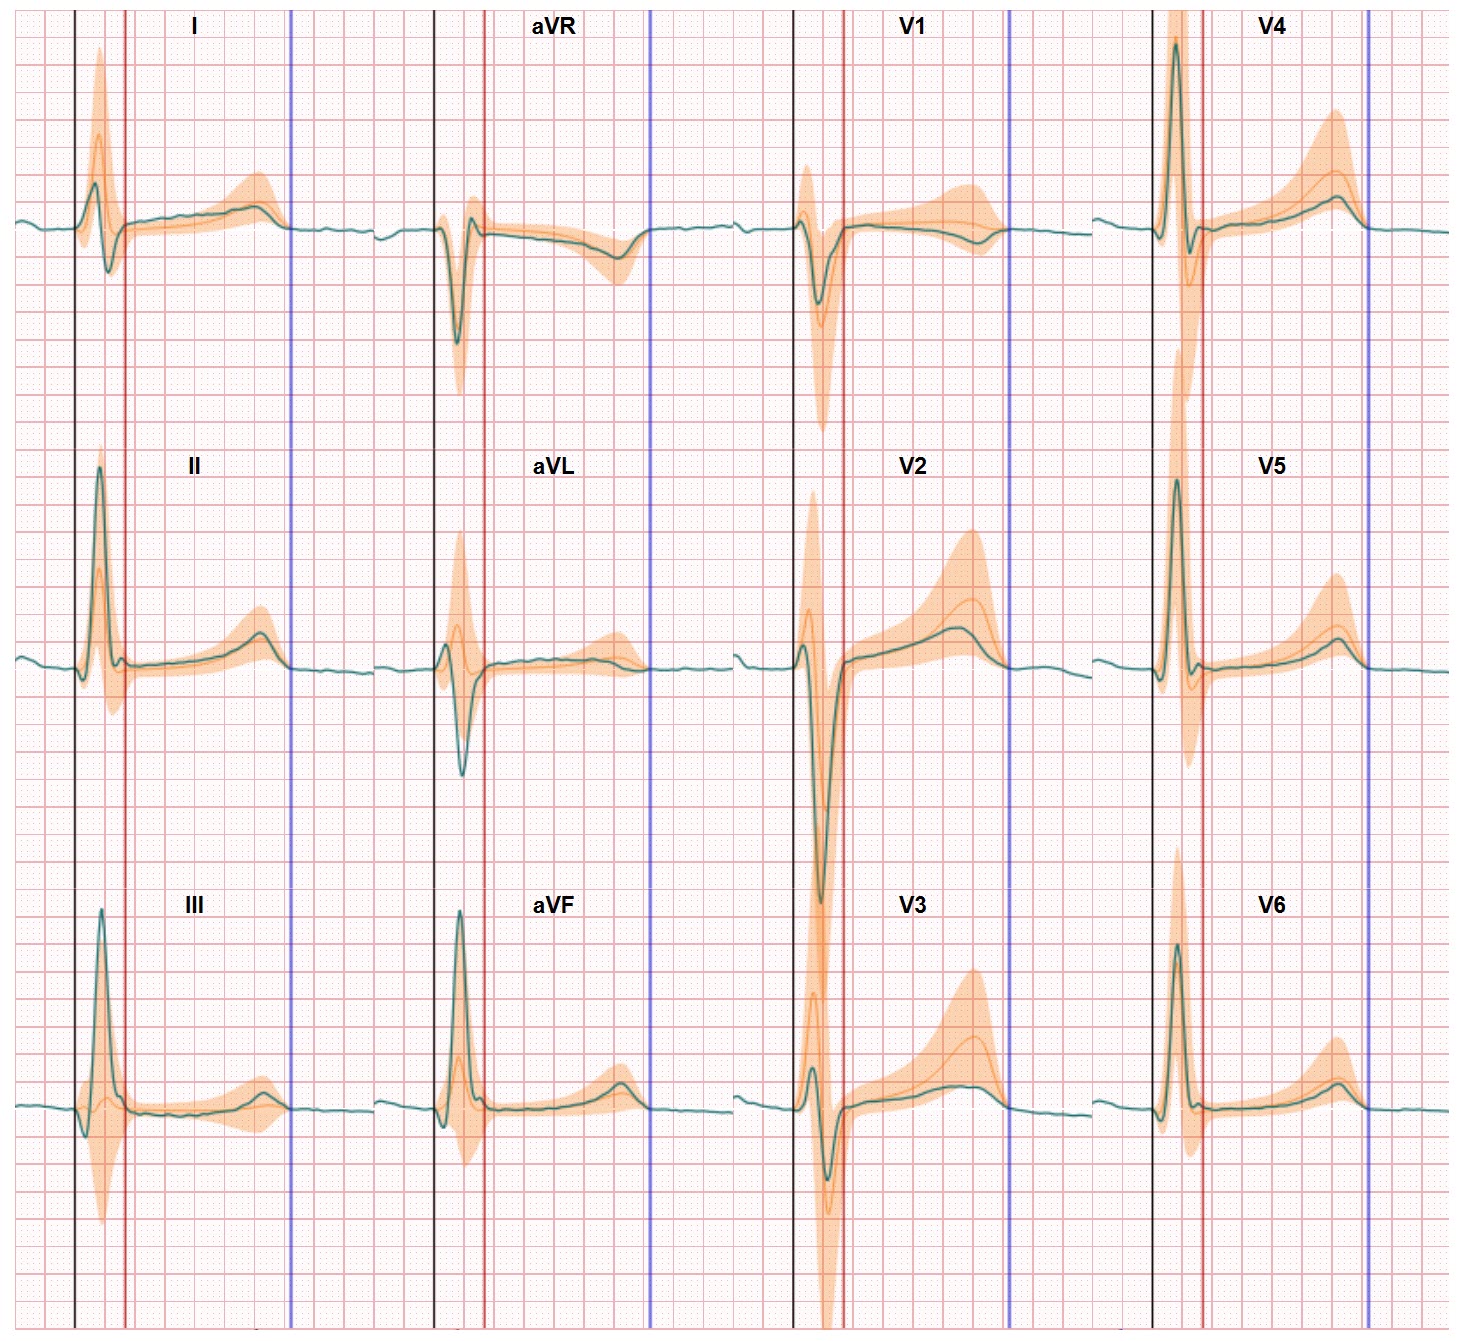
However, interpretation of the ECG waveforms is still a true challenge, even for well trained and experienced physicians. This type of analysis still results in qualitative terms such as elevated ST or inverted T wave. As result a recent comparison study published in JAMA Internal Medicine (September 2020) showed only 54% of 12 leads ECG are interpreted correct by physicians.
CineECG offers a new approach towards accurate and fast ECG interpretation
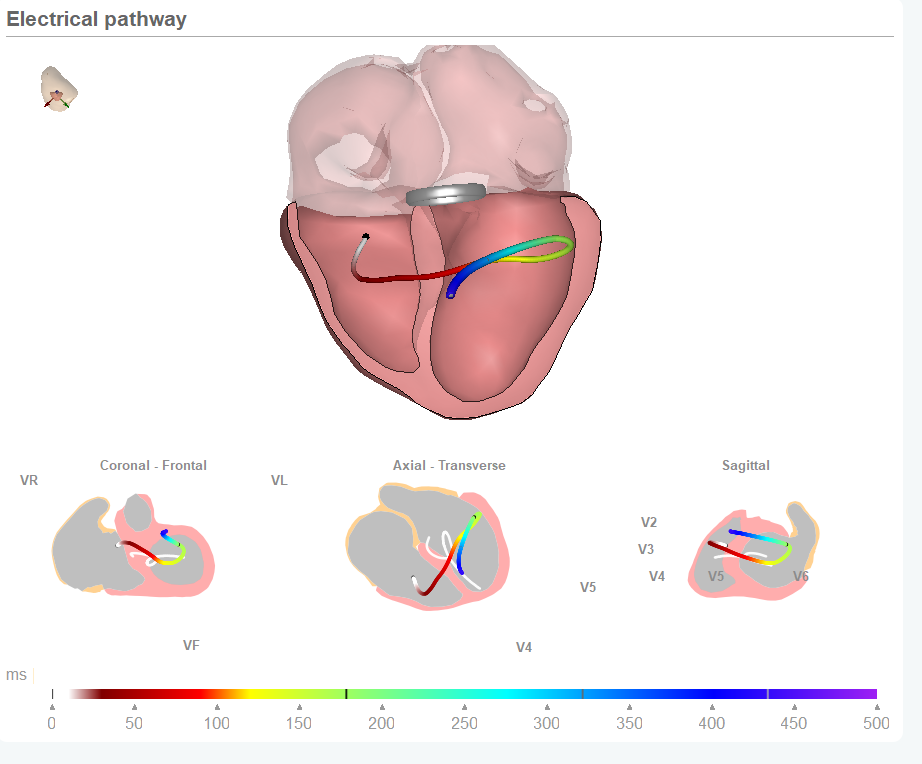
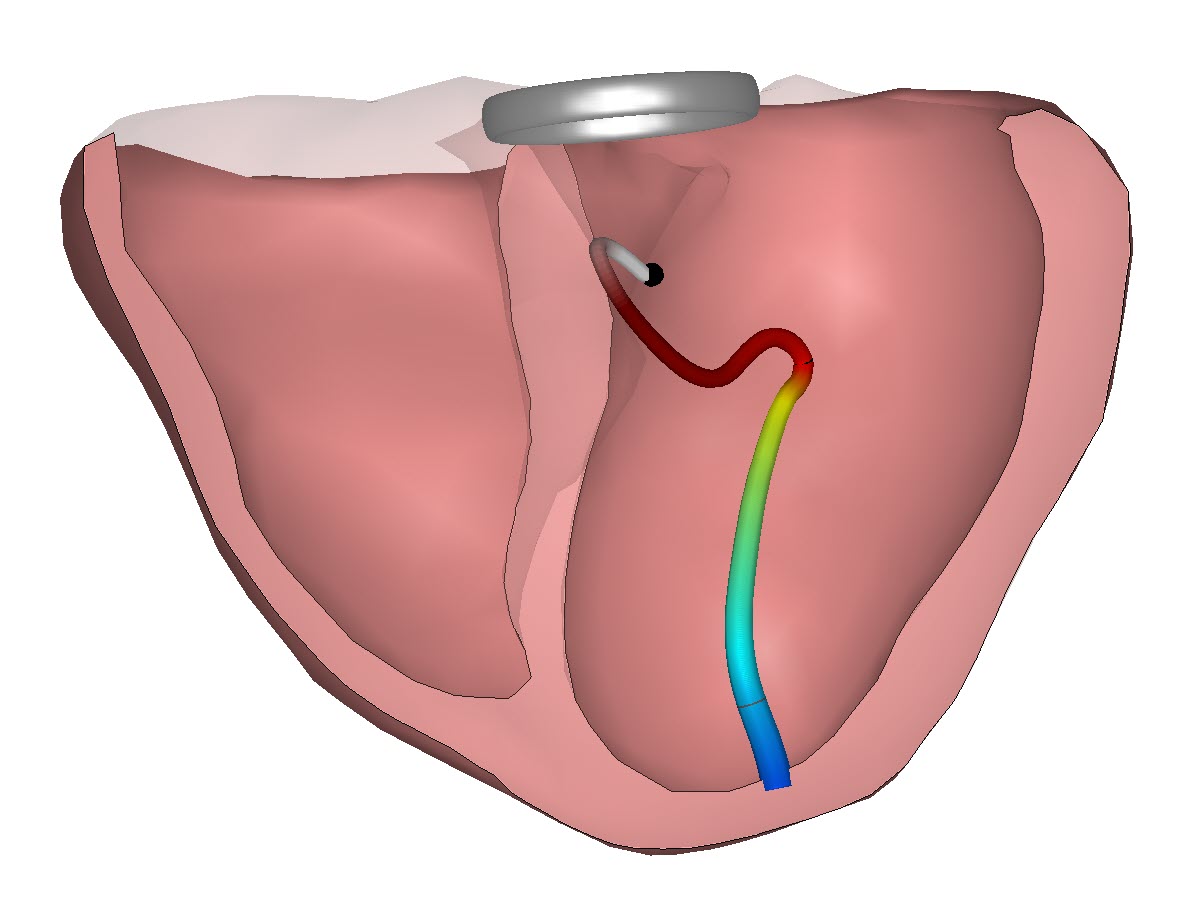
CineECG is a new way of processing standard 12 lead ECG/EKG data and provides an instant easy and better way of identifying differences between normal and abnormal heart activation and recovery based on the patient’s ECG QRS and T-wave form. This way CineECG supports physicians in early identification of patients who need extra attention when they manifest themselves at a (first line) physician with perceived heart disorder symptoms.
We are now introducing our CineECG blogs to bring you information from the world of ECG interpretation. And to demonstrate the ease and added value of CineECG.
In future blogs we will take a deeper dive into specific ECG interpretation cases.